
Fig. 2
- ID
- ZDB-FIG-250807-75
- Publication
- Chen et al., 2025 - ATF7IP/SETDB1-mediated epigenetic programming regulates thymic homing and T lymphopoiesis of hematopoietic progenitors during embryogenesis
- Other Figures
- All Figure Page
- Back to All Figure Page
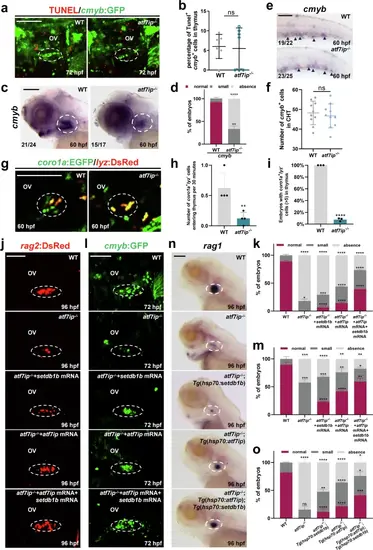
Atf7ip interacts with Setdb1 to coordinate T lymphoid progenitor migration and differentiation.a, b Double immunostaining showing cmyb:GFP+/TUNEL+ cells in thymus (white circles) of WT and atf7ip−/− mutants at 72 hpf. Quantification is shown in (b), n = 7. c, d WISH analysis of cmyb in thymus (white circles) of atf7ip−/− mutants and siblings at 60 hpf. Red, dark gray and light gray squares indicate normal (45-90), small (10-45), and absence (0-10) foci in thymus, respectively. Quantifications of WISH phenotype distribution are shown in (d), 3 independent experiments. e, f WISH analysis of cmyb in atf7ip−/− CHTs and WT CHTs (black arrows) at 60 hpf. Quantification of cmyb+ cells in thymus is shown in (f), n = 10. g, h Confocal imaging exhibiting coro1a:EGFP+/lyz:DsRed- cells entering the thymus (white circles) within 30 min in WT and atf7ip− embryos at 60 hpf. Quantifications of coro1a:EGFP+/lyz:DsRed- cells entering the thymus are shown in (h), n = 4. i Quantifications of embryos with coro1a:EGFP+/lyz:DsRed- cells ( > 5) in thymus of WT and atf7ip−/− embryos at 84 hpf, n = 3. j, k Confocal imaging exhibiting rag2:DsRed+ cells in thymus (white circles) of WT, atf7ip−/− mutants, setdb1b mRNA-injected atf7ip−/− mutants, atf7ip mRNA-injected atf7ip−/− mutants, setdb1b/atf7ip mRNA-injected atf7ip−/− mutants at 96 hpf. Quantifications of embryos distribution with rag2+ cells are shown in (k), 3 independent experiments. l, m Confocal imaging exhibiting cmyb:GFP+ cells in thymus (white circles) of WT, atf7ip−/− mutants, setdb1b mRNA-injected atf7ip−/− mutants, atf7ip mRNA-injected atf7ip−/− mutants, setdb1b/atf7ip mRNA-injected atf7ip−/− mutants at 72 hpf. Quantifications of cmyb+ cells are shown in (m), 3 independent experiments. n, o WISH analysis of rag1 in thymus (white circles) in WT, atf7ip−/− mutants, heat-shocked atf7ip−/−;Tg(hsp70:setdb1b) embryos, heat-shocked atf7ip−/−;Tg(hsp70:atf7ip), and heat-shocked atf7ip−/−;Tg(hsp70:atf7ip);Tg(hsp70:setdb1b) embryos at 96 hpf. Red, dark gray and light gray squares indicate normal (45-90), small (10-45), and absence (0-10) foci in thymus, respectively. Quantifications are shown in (o), 3 independent experiments. Scale bar, 100 μm (a, c, e, g, j, l, n). Quantifications (b, d, f, h, i, k, m, o) are represented as mean ± SD; ns, P > 0.05, *P < 0.05, **P < 0.01, ***P < 0.001, ****P < 0.0001. Student’s t test (unpaired, two-tailed). Source data are provided as a Source Data file. |