
|
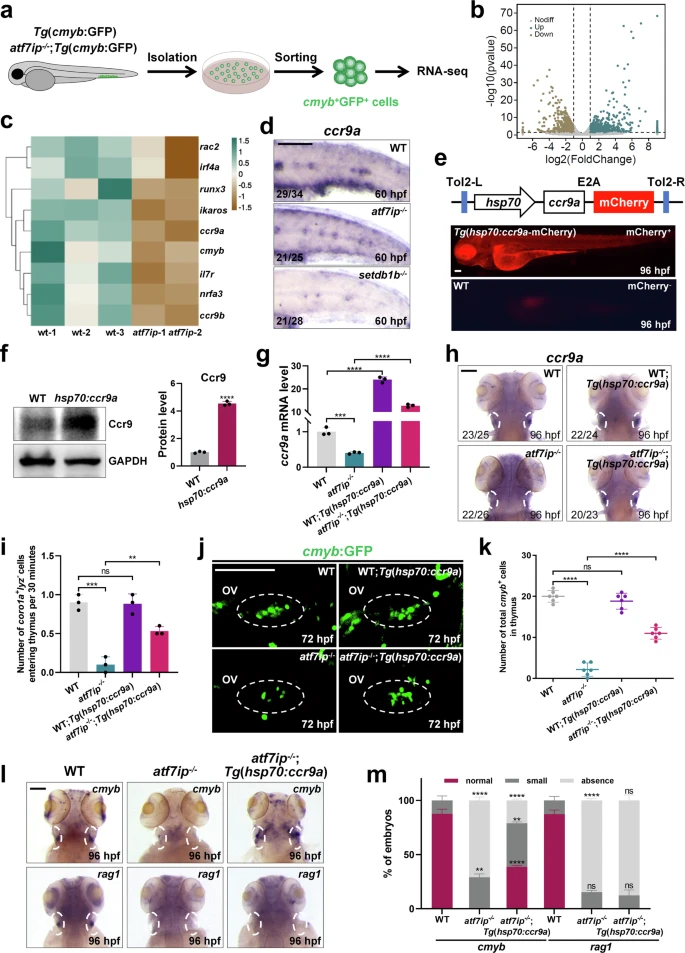
Fig. 4 ccr9a induction in atf7ip−/− embryos restores the thymic migration of T lymphoid progenitors.a Schematic workflow of RNA-seq from FACS-sorted cmyb+ cells in WT and atf7ip−/− mutants on Tg(cmyb:GFP) background at 72 hpf. b Volcano plot showing genes with increased expression (green) and decreased expression (brown) (Fold change > 1.5; P-value < 0.05) in atf7ip−/− mutants versus WT at 72 hpf. P-values were calculated using DESeq2 with two-sided Wald test and adjusted for multiple comparisons (Benjamini-Hochberg). c Heatmap showing the expression level of lymphopoiesis-related signature genes in atf7ip−/− mutants and WT at 72 hpf. d WISH analysis of ccr9a in CHT region of WT, atf7ip−/− and setdb1b−/− mutants at 60 hpf. e Schematic diagram showing the construct of full-length ccr9a gene driven by hsp70 promoter on tol2 vector (up). Fluorescent microscopy depicting the expression of hsp70:ccr9a-mCherry in WT at 96 hpf (down). f Immunoblot and quantification of Ccr9 protein level in WT and heat-shocked Tg(hsp70:ccr9a) embryos at 96 hpf, n = 3. g qPCR analysis of the relative mRNA levels of ccr9a in WT, atf7ip−/− mutants, heat-shocked Tg(hsp70:ccr9a) and atf7ip−/−;Tg(hsp70:ccr9a) embryos at 96 hpf, n = 3. h WISH analysis of ccr9a in thymus (white circles) of WT, atf7ip−/− mutants, heat-shocked Tg(hsp70:ccr9a) and heat-shocked atf7ip−/−;Tg(hsp70:ccr9a) embryos at 96 hpf, 3 independent experiments. i Number of coro1a:EGFP+/lyz:DsRed- cells entering the thymus every 30 min in WT, atf7ip−/− mutants, heat-shocked Tg(hsp70:ccr9a) and atf7ip−/−;Tg(hsp70:ccr9a) embryos, n = 3. j, k Confocal imaging showing lymphoid progenitors in thymus (white circles) of WT, atf7ip−/− mutants, heat-shocked Tg(hsp70:ccr9a) and atf7ip−/−;Tg(hsp70:ccr9a) embryos in cmyb:GFP transgenic background at 72 hpf. Quantification of cmyb+ cells is shown in (k), n = 6. l, m WISH analysis of cmyb and rag1 in thymus (white circles) of WT, atf7ip−/− mutants and heat-shocked atf7ip−/−;Tg(hsp70:ccr9a) embryos at 96 hpf. Red, dark gray and light gray squares indicate normal (cmyb/rag1: 45-90), small (cmyb/rag1: 10-45), and absence (cmyb/rag1: 0-10) foci in thymus, respectively. Quantifications of WISH distribution are shown in (m), 3 independent experiments. Scale bar, 100 μm (d, e, h, j, l). Quantifications (f, g, i, k, m) are represented as mean ± SD; ns, P > 0.05, *P < 0.05, **P < 0.01, ***P < 0.001, ****P < 0.0001. Student’s t test (unpaired, two-tailed). Source data are provided as a Source Data file.