
|
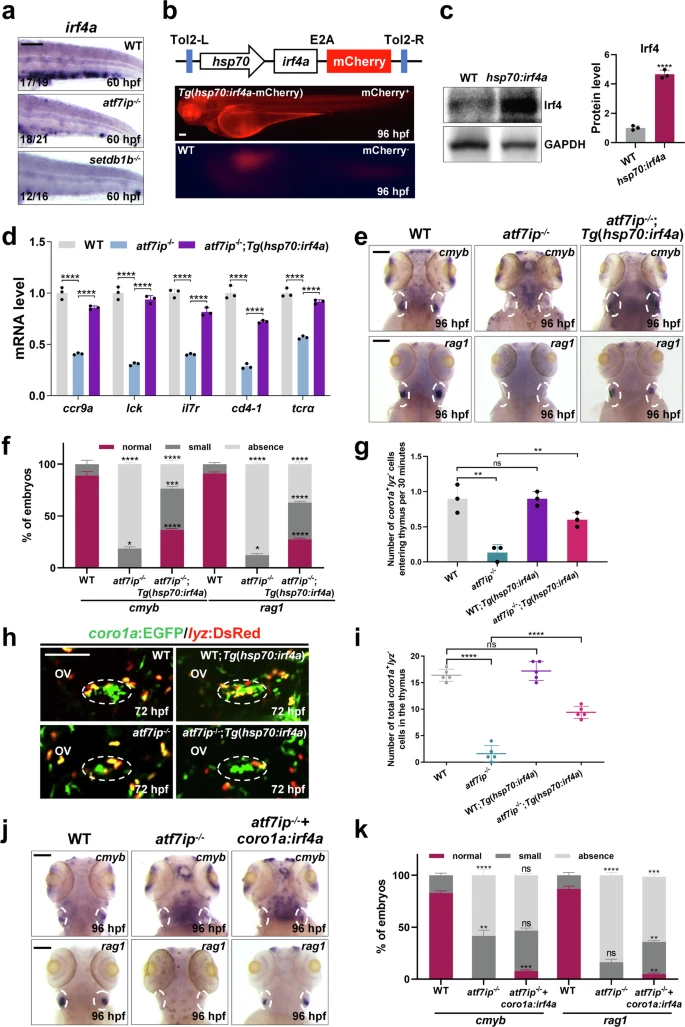
Fig. 5 T cell differentiation and migration are impaired due to irf4a reduction in atf7ip−/− mutants.a WISH analysis of irf4a in CHT of WT, atf7ip−/− mutants and setdb1b−/− mutants at 60 hpf. b Schematic diagram showing the construct of full-length irf4a gene driven by hsp70 promoter on tol2 vector (up). Fluorescent microscopy depicting the expression of hsp70:irf4a-mCherry in WT at 96 hpf (down). c Immunoblot and quantification depicting the protein level of Irf4 in WT and heat-shocked Tg(hsp70:irf4a)embryos at 96 hpf, n = 3. d qPCR analysis of ccr9a, lck, il7r, cd4-1 and tcra in whole embryos of WT, atf7ip−/− mutants and heat-shocked atf7ip−/−;Tg(hsp70:irf4a) embryos at 96 hpf, n = 3. e, f WISH analysis of cmyb and rag1 in thymus (white circles) of WT, atf7ip−/− mutants and heat-shocked atf7ip−/−;Tg(hsp70:irf4a) embryos at 96 hpf. Red, dark gray and light gray squares indicate normal (cmyb/rag1: 45-90), small (cmyb/rag1: 10-45), and absence (cmyb/rag1: 0-10) foci in thymus, respectively. Quantifications of WISH distribution are shown in (f), 3 independent experiments. g Number of coro1a:EGFP+/lyz:DsRed- cells entering the thymus every 30 min in WT, atf7ip−/− mutants, heat-shocked Tg(hsp70:irf4a) and atf7ip−/−;Tg(hsp70:irf4a) embryos, n = 3. h, i Confocal imaging showing lymphoid progenitors in thymus (white circles) of WT, atf7ip−/− mutants, heat-shocked Tg(hsp70:irf4a) and atf7ip−/−;Tg(hsp70:irf4a) embryos in coro1a:EGFP/lyz:DsRed transgenic background at 72 hpf. Quantification is shown in (i), n = 5. j, k WISH displaying cmyb and rag1 expression in thymus (white circles) in WT, atf7ip−/− mutants and atf7ip−/− mutants injected with coro1a-irf4a/tol2 constructs at 96 hpf. Red, dark gray and light gray squares indicate normal (cmyb/rag1: 45-90), small (cmyb/rag1: 10-45), and absence (cmyb/rag1: 0-10) foci in thymus, respectively. Quantifications of WISH phenotype distribution are shown in (k), 3 independent experiments. Scale bar, 100 μm (a, b, e, h, j). Quantifications (c, d, f, g, i, k) are represented as mean ± SD; ns, P > 0.05, *P < 0.05, **P < 0.01, ***P < 0.001, ****P < 0.0001. Student’s t test (unpaired, two-tailed). Source data are provided as a Source Data file.