
|
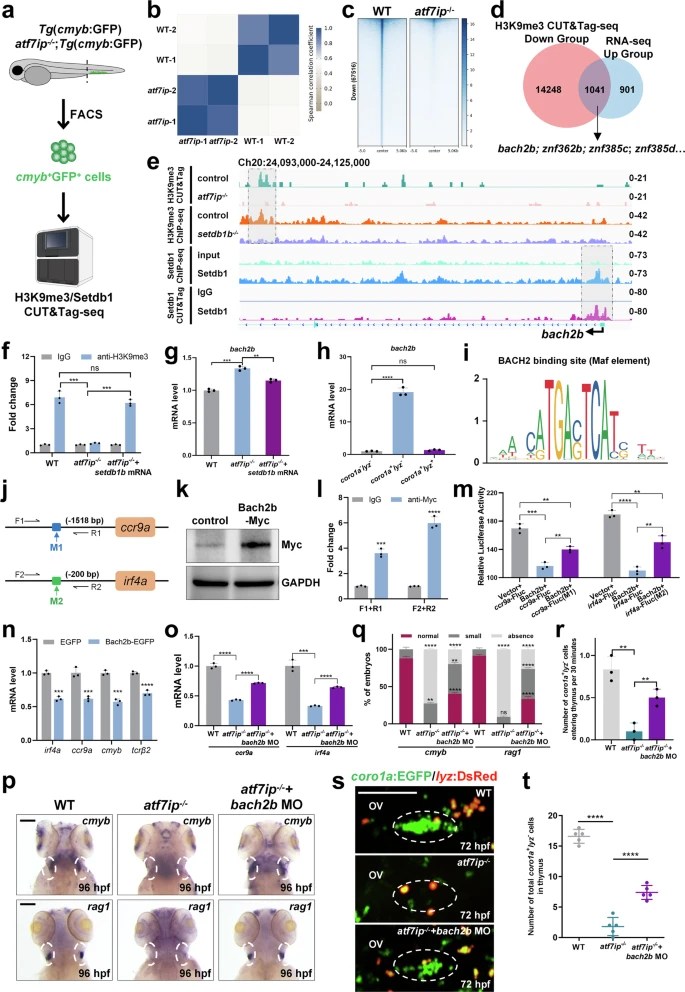
Fig. 6 Atf7ip cooperates with Setdb1 to target bach2b. a Schematic workflow of H3K9me3 and Setdb1 CUT&Tag-seq from FACS-sorted cmyb+ cells in WT and atf7ip−/− mutants at 72 hpf. b Heatmap of replicate correlations for H3K9me3 CUT&Tag in WT and atf7ip−/− mutants. c Heatmap for differentially enriched H3K9me3 peaks in whole genomes of WT and atf7ip−/− mutants. d Venn diagram displaying overlaps between gene-sets with reduced H3K9me3 and increased RNA-seq levels in atf7ip−/− mutants. e IGV tracks of H3K9me3 CUT&Tag-seq, H3K9me3 ChIP-seq, Setdb1 ChIP-seq and Setdb1 CUT&Tag-seq at bach2b locus in WT, atf7ip−/− and setdb1b−/− mutants. f CUT&Tag-qPCR of H3K9me3 levels at bach2b in WT, atf7ip−/−, setdb1b mRNA-injected atf7ip−/− mutants, n = 3. g qPCR of bach2b in WT, atf7ip−/− and setdb1b mRNA-injected atf7ip−/− mutant at 96 hpf, n = 3. h qPCR of bach2b in coro1a-lyz-, coro1a+lyz- and coro1a+lyz+ cells at 96 hpf, n = 3. i JASPAR database displaying BACH2 binding site (Maf element) in ccr9a and irf4a promoters. j CUT&Tag and luciferase reporter assay schematic with primers for ccr9a and irf4a promoters. k Immunoblot of Myc in bach2b-myc mRNA-injected embryos, n = 3. l qPCR of DNA fragments obtained from CUT&Tag assay with primers (F1, R1 or F2, R2), n = 3. m Luciferase activity in HEK293T cells after co-transfection of pGL3-ccr9a-Fluc, Bach2b, and pGL3-ccr9a-Mutant1 (M1), or pGL3-irf4a-Fluc, Bach2b, and pGL3-irf4a-Mutant2 (M2), n = 3. n qPCR of irf4a, ccr9a, cmyb, tcrβ2 in whole embryos of EGFP or bach2b-EGFP mRNA-injected WT (EGFP or Bach2b-EGFP) at 72 hpf, n = 3. o qPCR of ccr9a and irf4a in whole embryos of WT, atf7ip−/− and atf7ip−/− mutants injected with bach2b MO (8 ng per embryo) at 72 hpf, n = 3. p, q WISH displaying cmyb and rag1 expression in thymus (white circles) of WT, atf7ip−/− and bach2b MO-injected atf7ip−/− mutants at 96 hpf. Red, dark gray and light gray squares indicate normal (cmyb/rag1: 45-90), small (cmyb/rag1: 10-45), absence (cmyb/rag1: 0-10) foci. Quantifications are shown in (q), 3 independent experiments. r Number of coro1a:EGFP+/lyz:DsRed- cells entering thymus every 30 min in WT, atf7ip−/−, bach2b MO-injected atf7ip−/− embryos, n = 3. s, t Confocal imaging showing thymic lymphoid progenitors (white circles) of WT, atf7ip−/− and bach2b MO-injected atf7ip−/− embryos on Tg(coro1a:EGFP/lyz:DsRed) background at 72 hpf. Quantification is shown in (t), n = 3. Scale bar, 100 μm (p, s). Quantifications (f–h, l–o, q, r, t) are represented as mean ± SD; ns, P > 0.05, *P < 0.05, **P < 0.01, ***P < 0.001, ****P < 0.0001. Student’s t test (unpaired, two-tailed). Source data are provided as a Source Data file.