
Fig. 1
- ID
- ZDB-FIG-250807-74
- Publication
- Chen et al., 2025 - ATF7IP/SETDB1-mediated epigenetic programming regulates thymic homing and T lymphopoiesis of hematopoietic progenitors during embryogenesis
- Other Figures
- All Figure Page
- Back to All Figure Page
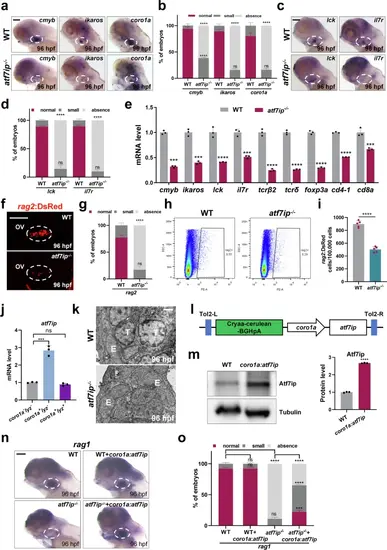
atf7ip−/− mutants exhibit a reduction in T lymphocytes during embryogenesis.a, b WISH analysis of cmyb, ikaros and coro1a in thymus (white circles) of atf7ip−/− mutants and WT at 96 hpf. Red, dark gray and light gray squares indicate normal (cmyb: 45-90; ikaros: 30-60; coro1a: 45-90), small (cmyb: 10-45; ikaros: 10-30; coro1a: 20-45), and absence (cmyb: 0-10; ikaros: 0-10; coro1a: 0-20) foci in thymus. Quantifications of WISH phenotype distribution are shown in b 3 independent experiments. c, d WISH analysis of lck and il7r in thymus (white circles) of atf7ip−/− mutants and WT at 96 hpf. Red, dark gray and light gray squares indicate normal (30-60), small (10-30), and absence (0-10) foci in thymus. Quantifications are shown in (d, 3 independent experiments. e qPCR analysis of ikaros, cmyb, lck, il7r, tcrβ2, tcrδ, foxp3a, cd4-1 and cd8a in whole embryos of WT and atf7ip−/− mutants at 96 hpf, n = 3. f, g Confocal imaging of thymic lymphocytes (white circles) in WT and atf7ip−/− mutants on Tg(rag2:DsRed) background at 96 hpf. Quantification is shown in (g), 3 independent experiments. h, i Representative FACS of rag2:DsRed cells in WT and atf7ip−/− mutants at 96 hpf. Quantification is shown in (i), n = 5. j qPCR analysis of atf7ip in coro1a-lyz-, coro1a+lyz- and coro1a+lyz+ cells at 60 hpf, n = 3. k TEM analysis of thymic cellular structure in WT and atf7ip−/− mutants at 96 hpf. Scale bar, 10 μm. T, T lymphocytes; E, thymic epithelial cells. l Schematic of full-length atf7ip gene driven by the coro1a promoter on tol2 vector. m Immunoblot and quantification of Atf7ip protein level in coro1a:atf7ip/tol2-injected embryos at 96 hpf, n = 3. n, o WISH analysis of rag1 in thymus (white circles) of WT, atf7ip−/− mutants and coro1a:atf7ip/tol2-injected embryos at 96 hpf. Red, dark gray and light gray squares indicate normal (45-90), small (10-45), and absence (0-10) foci in thymus. Quantifications of WISH are shown in (o), 3 independent experiments. Scale bar, 100 μm (a, c, f, n). Quantifications (b, d, e, g, i, j, m, o) are represented as mean ± SD; ns, P > 0.05, *P < 0.05, **P < 0.01, ***P < 0.001, ****P < 0.0001. Student’s t test (unpaired, two-tailed). Source data are provided as a Source Data file. |