
- Title
-
Deregulated nutrient response in ttntv cardiomyopathy can be repaired via Erk inhibition for cardioprotective effects
- Authors
- Yan, F., Wang, W., Moossavi, M., Zhu, P., Odell, N., Xu, X.
- Source
- Full text @ J. Mol. Cell. Cardiol.
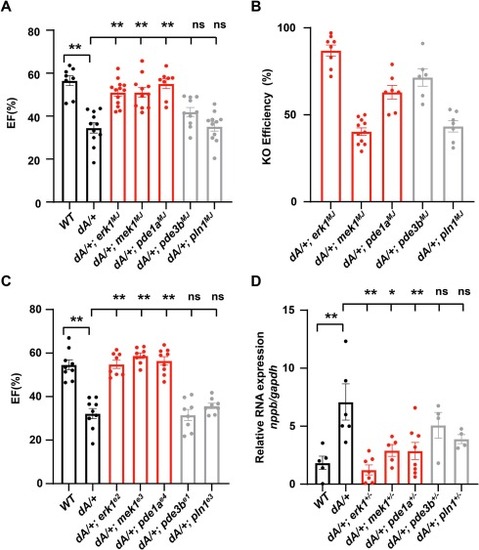
An F0-based MMEJ screening identified erk1 and mek1 as therapeutic modifiers of ttntv DCM. (A) Quantification of the ejection fraction in adult F0 zebrafish at 3 months via high-frequency echocardiography. (n ≥8 per group). (B) Quantification of representative knock out scores in F0 fish at 3 months. (n ≥6 per group) (C) Quantification of ejection fraction in F1 zebrafish at 3 months via high-frequency echocardiography. (n ≥ 8 per group). (D) Evaluation of nppb gene transcripts expression by quantitative RT-PCR in hearts from 3 months adult zebrafish. n ≥4 per group. One-way ANOVA was used to compare multiple groups for each mutation. Data are presented as mean ± SEM, *p < 0.05, **p < 0.01. WT, wild type, ns, non-significant. |
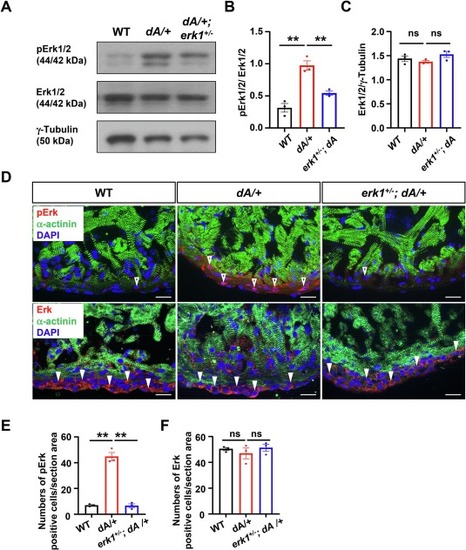
ERK signaling is aberrantly activated in ttntv DCM. (A) Representative western blots of Erk1/2, pErk1/2 and γ-Tubulin from 3 months old zebrafish hearts. (B) and (C) Quantification of pErk and Erk in (A). One-way ANOVA was used to compare multiple groups for each mutation. Data are presented as mean ± SEM, three biological replicates, **p < 0.01. WT, wild type, ns, non-significant (D) Representative images of Erk and pErk in cryosectioned heart tissues of WT, dA/+ and erk1+/−; dA/+ zebrafish mutants co-immunostained using anti-α-actinin antibody with anti-Erk antibody or anti-pErk antibody. α-actinin, green. Erk and pErk, red. DAPI, blue. The open arrowheads and filled arrowheads indicate pErk and Erk, respectively. Erk indicates total Erk1/2; pErk, phosphorylated Erk1/2. Scale bars: 20 μm. (E) and (F) Quantification of pErk and Erk of (D). One-way ANOVA was used to compare multiple groups for each mutation. Data are presented as mean ± SEM, three biological replicates, **p < 0.01. WT, wild type, ns, non-significant. (For interpretation of the references to colour in this figure legend, the reader is referred to the web version of this article.) |
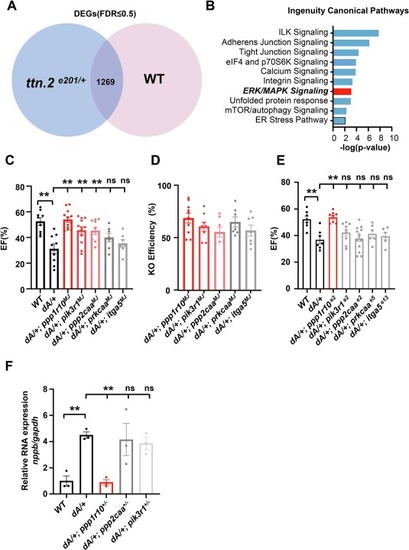
An F0-based genetic screen of DEGs in Erk signaling pathway identified ppp1r10 as another therapeutic modifier. (A) Transcriptome analysis of ventricles from ttnae201/+ and WT at 6 months identified 1269 DE genes. (B) IPA analysis identified candidate pathways that warrant further investigation. (C) Quantification of ejection fraction in F0 adult zebrafish at 3 months via high-frequency echocardiography. (n ≥ 6 per group). (D) Quantification of representative knock out scores in F0 fish at 3 months. (E) Quantification of ejection fraction in F1 zebrafish at 3 months via high-frequency echocardiography. (n ≥ 6 per group). (F) Evaluation of nppb gene transcripts expression by quantitative RT-PCR in hearts from 6 months adult zebrafish. n ≥ 3. One-way ANOVA was used to compare multiple groups for each mutation. Data are presented as mean ± SEM, **p < 0.01. WT, wild type, ns, non-significant. |
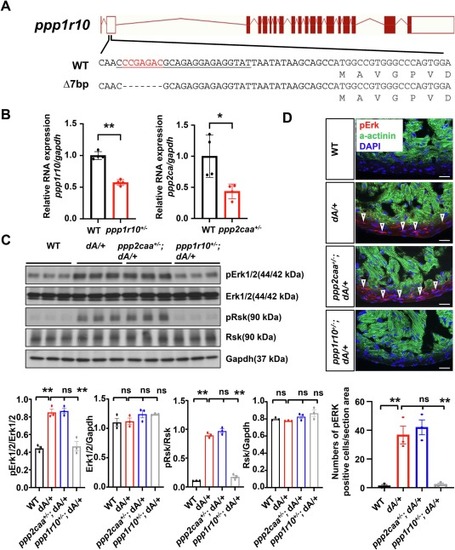
ppp1r10 inhibition rescues aberrantly activated Erk signaling in dA/+. (A) Schematics of ppp1r105’UTR generated by MMEJ sgRNA. The underlined sequence indicates sgRNA sequence, red indicates deleted nucleotides. (B) Evaluation of ppp1r10 and ppp2caa gene transcripts expression by quantitative RT-PCR in hearts from heterozygous ppp1r10+/− and ppp2ca+/− adult zebrafish at 3 months old. n = 4. t-test was used to compare 2 groups. Data are presented as mean ± SEM, *p < 0.05, **p < 0.01. (C) Representative western blots of protein Erk, pErk, Rsk, pRsk and Gapdh from 3 months old zebrafish hearts and quantification of Erk, pErk, Rsk, and pRsk. One-way ANOVA was used to compare multiple groups for each mutation. Data are presented as mean ± SEM, three biological replicates, **p < 0.01. WT, wild type, ns, non-significant. (D) Representative images and quantification of pErk in cryosectioned heart tissues of WT, dA/+, ppp2caa+/−; dA/+ and ppp1r10+/−; dA/+ zebrafish mutants co-immunostained using anti-pErk antibody and anti-α-actinin antibody. α-actinin, green. pErk, red. DAPI, blue. The open arrowheads indicate pErk. pErk, phosphorylated Erk1/2. Scale bars: 20 μm. One-way ANOVA was used to compare multiple groups for each mutation. Data are presented as mean ± SEM, three biological replicates, **p < 0.01. WT, wild type, ns, non-significant. (For interpretation of the references to colour in this figure legend, the reader is referred to the web version of this article.) |
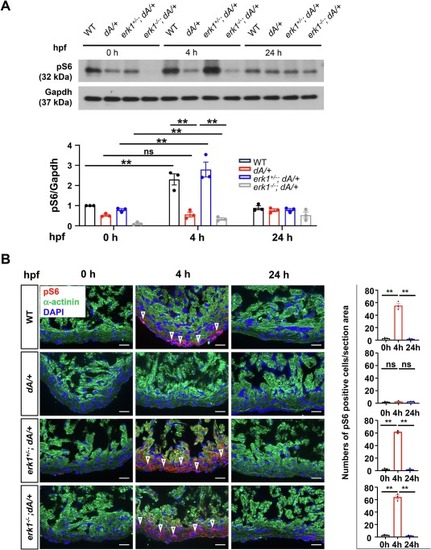
Deregulated nutrient response is a pathological event in dA/+ that can be rescued by erk1 inhibition. (A) Representative western blots of protein pS6 and Gapdh from 3 months old zebrafish hearts at 0/4/24 h post feeding and quantification of pS6. One-way ANOVA was used to compare multiple groups. Data are presented as mean ± SEM, three biological replicates, **p < 0.01, WT, wild type, ns, non-significant. (B) Representative images and quantification of pS6 in cryosectioned heart tissues of WT, dA/+, erk1+/−; dA/+ and erk1−/−; dA/+ zebrafish mutants at 0/4/24 h post feeding, co-immunostained using anti-pS6 antibody and anti-α-actinin antibody. α-actinin, green. pS6, red. DAPI, blue. The open arrowheads indicate pS6 signal. pS6 indicates phosphorylated S6 ribosomal protein. Scale bars: 20 μm. One-way ANOVA was used to compare multiple groups. Data are presented as mean ± SEM, three biological replicates, **p < 0.01, WT, wild type, ns, non-significant. (For interpretation of the references to colour in this figure legend, the reader is referred to the web version of this article.) |
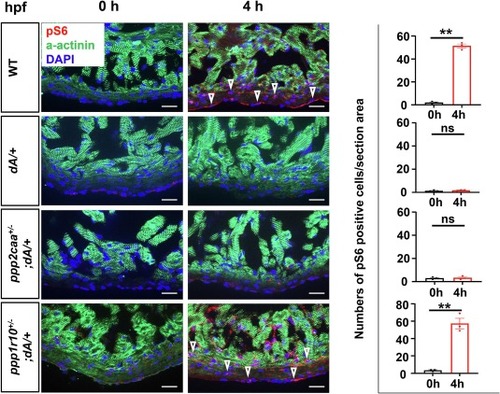
ppp1r10, but not ppp2caa inhibition, rescues the deregulated nutrient response in dA/+. Representative images and quantification of pS6 in cryosectioned heart tissues of WT, dA/+, ppp2caa+/−; dA/+ and ppp1r10+/−; dA/+ zebrafish mutants at 0/4 h post feeding, co-immunostained using anti-pS6 antibody and anti-α-actinin antibody. a-α−ctinin, green. pS6, red. DAPI, blue. The open arrowheads indicate pS6 signal. pS6 indicates phosphorylated S6 ribosomal protein. Scale bars: 20 μm. One-way ANOVA was used to compare multiple groups. Data are presented as mean ± SEM, three biological replicates, **p < 0.01. WT, wild type, ns, non-significant. (For interpretation of the references to colour in this figure legend, the reader is referred to the web version of this article.) |
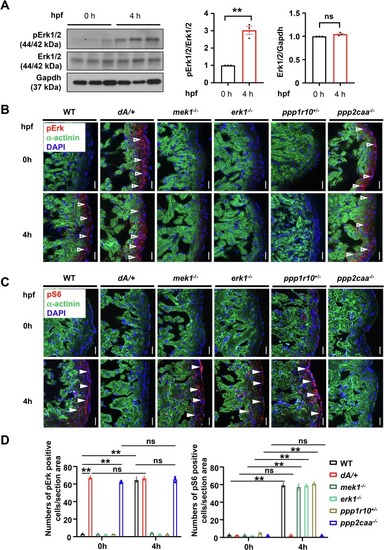
Constitutively activated pERK in ppp2caa−/− manifests deregulated nutrient response. (A) pERK is activated by nutrients. Shown are representative western blots of pErk1/2, Erk1/2 and Gapdh from 3 months old zebrafish hearts and quantification of pErk and Erk. t-test was used to compare 2 groups. Data are presented as mean ± SEM, three biological replicates, **p < 0.01, ns, non-significant. (B) and (C) Representative images of pS6 and pErk in cryosectioned heart tissues of WT, dA/+, mek−/−, erk−/−, ppp1r1+/− and ppp2caa−/− zebrafish mutants at 0/4 h post feeding, co-immunostained using anti-α-actinin antibody with anti-pErk antibody or pS6 antibody. α-actinin, green. pERK and pS6, red. DAPI, blue. The open arrowheads and filled arrowheads indicate pErk and pS6, respectively. pErk, phosphorylated Erk1/2; pS6, phosphorylated S6 ribosomal protein. Scale bars: 20 μm. (D) Quantification of pErk and pS6 in (B) and (C). Data are presented as mean ± SEM, and one-way ANOVA was used to compare multiple groups, three biological replicates, **p < 0.01, WT, wild type, ns, non-significant. |
Reprinted from Journal of Molecular and Cellular Cardiology, , Yan, F., Wang, W., Moossavi, M., Zhu, P., Odell, N., Xu, X., Deregulated nutrient response in ttntv cardiomyopathy can be repaired via Erk inhibition for cardioprotective effects, , Copyright (2025) with permission from Elsevier. Full text @ J. Mol. Cell. Cardiol.