
- Title
-
A β-galactosidase activated near-infrared fluorescent probe for tracking cellular senescence in vitro and in vivo
- Authors
- Su, T., Shen, R., Tu, D., Han, X., Luo, X., Yu, F.
- Source
- Full text @ Smart Mol
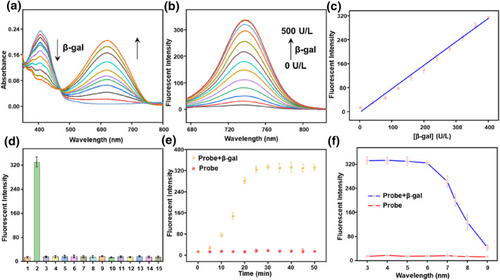
Spectral properties of the probe QMOH‐Gal (10 μM) to β‐gal in PBS containing 5% DMSO (pH = 7.4, 10 mM). (a) The ultraviolet‐visible absorption spectrum and (b) the fluorescence spectrum of QMOH‐Gal (10 μM) for β‐gal (0–500 U/L, |
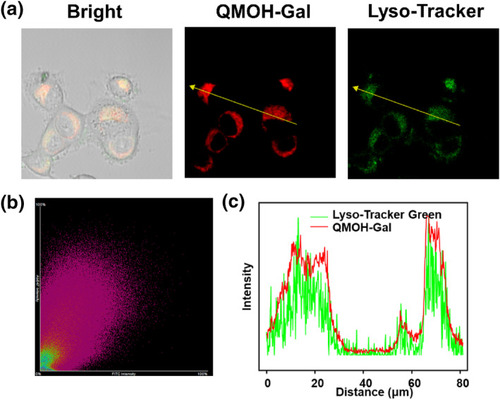
Lysosomal co‐localization studies of Lyso‐Tracker Green with QMOH‐Gal in Ovcar‐3 cells. (a) Fluorescence imaging of Lyso‐Tracker Green co‐incubated with the probe in Ovcar‐3 cells. (b) Correlation between the green and red regions crossed by the yellow arrows in (a). (c) Intensity distribution map of the green and red channels indicated by the yellow arrows in (a). Green channel: 500–560 nm ( |
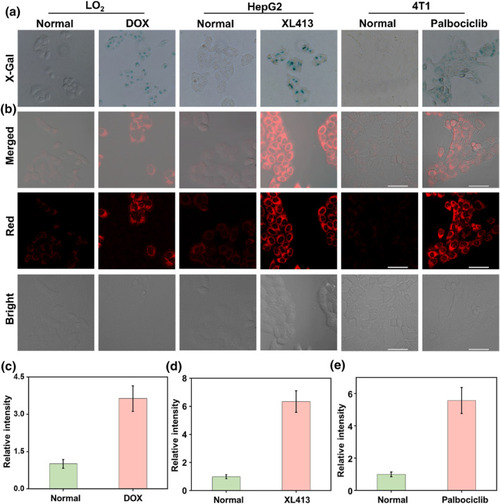
Visualization imaging of intracellular β‐gal. (a) X‐Gal staining of endogenous β‐gal in LO2 cells and DOX‐induced LO2 senescent cells, HepG2 cells and XL413‐induced HepG2 senescent cells, and 4T1 cells and palbociclib‐induced 4T1 senescent cells. (b) Fluorescence imaging of β‐gal with QMOH‐Gal in LO2 cells and DOX‐induced LO2 senescent cells, HepG2 cells and XL413‐induced HepG2 senescent cells, and 4T1 cells and palbociclib‐induced 4T1 senescent cells. (c) Relative fluorescent intensities in LO2 cells and DOX‐induced LO2 senescent cells. (d) Relative fluorescent intensities in HepG2 cells and XL413‐induced HepG2 senescent cells. (e) Relative fluorescent intensities in 4T1 cells and palbociclib‐induced 4T1 senescent cells. |
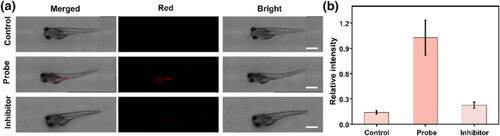
(a) Imaging of β‐gal with the QMOH‐Gal probe in zebrafish. Control group: Zebrafish do not undergo any treatment; probe group: the zebrafish was pre‐incubated with this probe QMOH‐Gal for 40 min and then imaged; inhibitor group: the zebrafish was stimulated with |
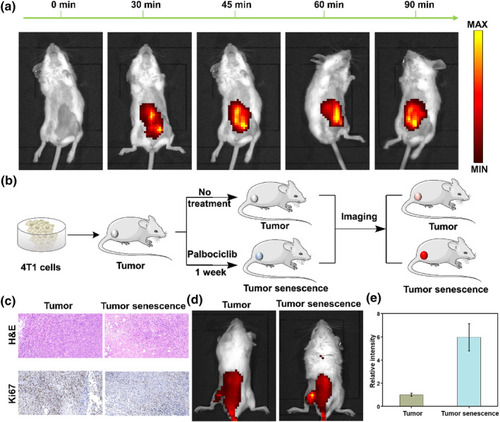
Imaging endogenous β‐gal in mice. (a) Imaging β‐gal in the mouse peritoneal cavity at different time points (0–90 min). (b) Schematic diagram of mouse tumor and senescence tumor modeling. (c) H&E and Ki67 staining for mouse tumors and palbociclib‐induced tumor senescence. (d) Imaging of β‐gal in mice tumor and senescence tumor modeling. (e) Relative fluorescence intensity in (d). |
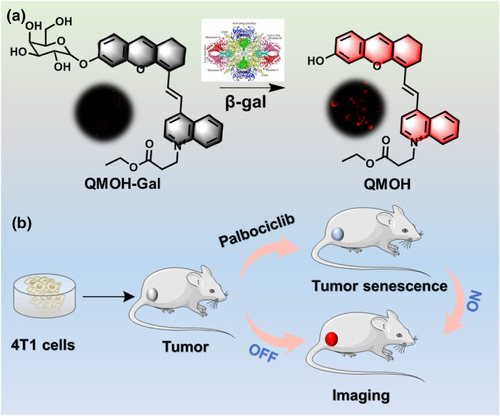
(a) The structure of this QMOH‐Gal probe and response mechanism to β‐gal. (b) The QMOH‐Gal probe for tracking cellular senescence in vivo. |