
FIGURE
FIGURE 2
- ID
- ZDB-FIG-250709-47
- Publication
- Su et al., 2025 - A β-galactosidase activated near-infrared fluorescent probe for tracking cellular senescence in vitro and in vivo
- Other Figures
- All Figure Page
- Back to All Figure Page
FIGURE 2
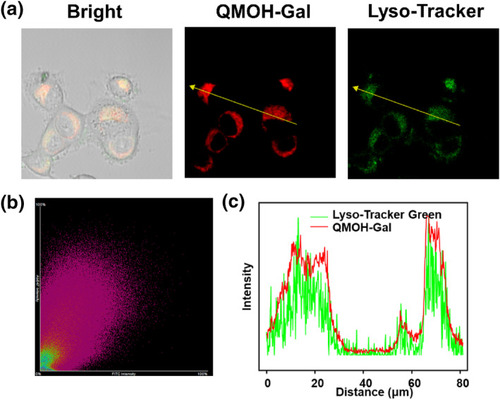
Lysosomal co‐localization studies of Lyso‐Tracker Green with QMOH‐Gal in Ovcar‐3 cells. (a) Fluorescence imaging of Lyso‐Tracker Green co‐incubated with the probe in Ovcar‐3 cells. (b) Correlation between the green and red regions crossed by the yellow arrows in (a). (c) Intensity distribution map of the green and red channels indicated by the yellow arrows in (a). Green channel: 500–560 nm ( |
Expression Data
Expression Detail
Antibody Labeling
Phenotype Data
Phenotype Detail
Acknowledgments
This image is the copyrighted work of the attributed author or publisher, and
ZFIN has permission only to display this image to its users.
Additional permissions should be obtained from the applicable author or publisher of the image.
Full text @ Smart Mol