FIGURE

FIGURE 1

ID
ZDB-FIG-250709-46
Publication
Su et al., 2025 - A β-galactosidase activated near-infrared fluorescent probe for tracking cellular senescence in vitro and in vivo
Other Figures
All Figure Page
Back to All Figure Page
FIGURE 1

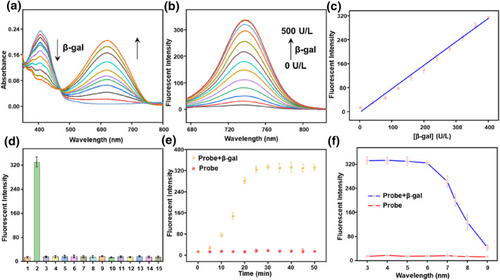
Spectral properties of the probe QMOH‐Gal (10 μM) to β‐gal in PBS containing 5% DMSO (pH = 7.4, 10 mM). (a) The ultraviolet‐visible absorption spectrum and (b) the fluorescence spectrum of QMOH‐Gal (10 μM) for β‐gal (0–500 U/L, λex = 640 nm, slit widths: 5/5 nm). (c) The linear relationship between the fluorescence intensity of QMOH‐Gal and β‐gal (0–400 U/L). (d) The reaction of QMOH‐Gal to a series of various analytes: (1) blank, (2) β‐gal (500 U/L), (3) esterase (500 U/L), (4) ALP (500 U/L), (5) AFU (100 U/L), (6) Cys (1 mM), (7) Hcy (1 mM), (8) GSH (1 mM), (9) BSA (100 μg/ml), 10. HClO (100 μM), (11) NaNO2 (100 μM), (12) H2O2 (100 μM), (13) Cl (100 μM), (14) Na+ (100 μM), (15) K+ (100 μM). Fluorescence spectrum at 740 nm of QMOH‐Gal (e) with time change and (f) pH effect to β‐gal at 37°C.

Expression Data

Expression Detail
Antibody Labeling
Phenotype Data

Phenotype Detail
Acknowledgments
This image is the copyrighted work of the attributed author or publisher, and ZFIN has permission only to display this image to its users. Additional permissions should be obtained from the applicable author or publisher of the image. Full text @ Smart Mol