
FIGURE
FIGURE 4
- ID
- ZDB-FIG-250709-49
- Publication
- Su et al., 2025 - A β-galactosidase activated near-infrared fluorescent probe for tracking cellular senescence in vitro and in vivo
- Other Figures
- All Figure Page
- Back to All Figure Page
FIGURE 4
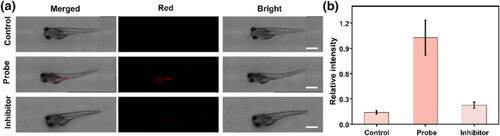
(a) Imaging of β‐gal with the QMOH‐Gal probe in zebrafish. Control group: Zebrafish do not undergo any treatment; probe group: the zebrafish was pre‐incubated with this probe QMOH‐Gal for 40 min and then imaged; inhibitor group: the zebrafish was stimulated with |
Expression Data
Expression Detail
Antibody Labeling
Phenotype Data
Phenotype Detail
Acknowledgments
This image is the copyrighted work of the attributed author or publisher, and
ZFIN has permission only to display this image to its users.
Additional permissions should be obtained from the applicable author or publisher of the image.
Full text @ Smart Mol