
FIGURE 3
- ID
- ZDB-FIG-250709-48
- Publication
- Su et al., 2025 - A β-galactosidase activated near-infrared fluorescent probe for tracking cellular senescence in vitro and in vivo
- Other Figures
- All Figure Page
- Back to All Figure Page
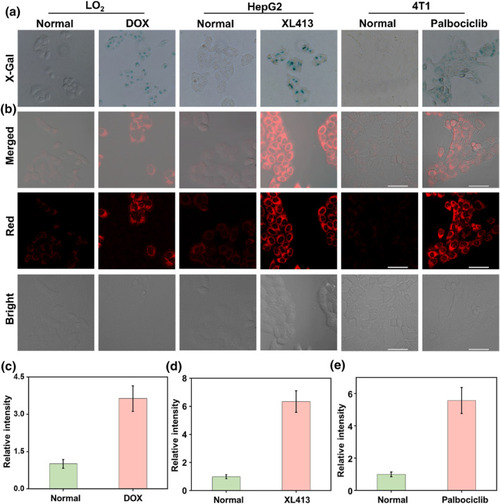
Visualization imaging of intracellular β‐gal. (a) X‐Gal staining of endogenous β‐gal in LO2 cells and DOX‐induced LO2 senescent cells, HepG2 cells and XL413‐induced HepG2 senescent cells, and 4T1 cells and palbociclib‐induced 4T1 senescent cells. (b) Fluorescence imaging of β‐gal with QMOH‐Gal in LO2 cells and DOX‐induced LO2 senescent cells, HepG2 cells and XL413‐induced HepG2 senescent cells, and 4T1 cells and palbociclib‐induced 4T1 senescent cells. (c) Relative fluorescent intensities in LO2 cells and DOX‐induced LO2 senescent cells. (d) Relative fluorescent intensities in HepG2 cells and XL413‐induced HepG2 senescent cells. (e) Relative fluorescent intensities in 4T1 cells and palbociclib‐induced 4T1 senescent cells. |