
Image
|
Figure Caption
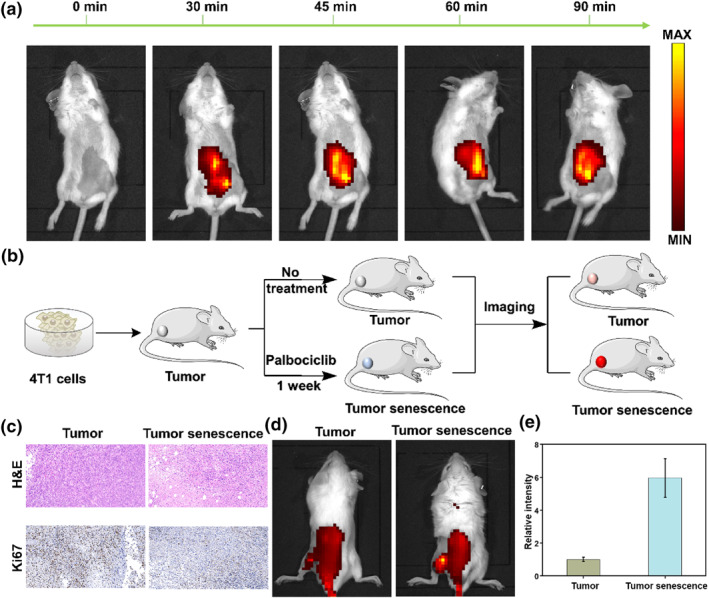
FIGURE 5
Imaging endogenous β‐gal in mice. (a) Imaging β‐gal in the mouse peritoneal cavity at different time points (0–90 min). (b) Schematic diagram of mouse tumor and senescence tumor modeling. (c) H&E and Ki67 staining for mouse tumors and palbociclib‐induced tumor senescence. (d) Imaging of β‐gal in mice tumor and senescence tumor modeling. (e) Relative fluorescence intensity in (d).
Acknowledgments
This image is the copyrighted work of the attributed author or publisher, and
ZFIN has permission only to display this image to its users.
Additional permissions should be obtained from the applicable author or publisher of the image.
Full text @ Smart Mol