
- Title
-
Inhibition of the minor spliceosome restricts the growth of a broad spectrum of cancers
- Authors
- Doggett, K., Morgan, K.J., Olthof, A.M., Mieruszynski, S., Williams, B.B., Garnham, A.L., Milevskiy, M.J.G., Whitehead, L., Coates, J., Buchert, M., O'Donoghue, R.J.J., Hall, T.E., Putoczki, T.L., Ernst, M., Sutherland, K.D., Kanadia, R.N., Heath, J.K.
- Source
- Full text @ EMBO Rep.
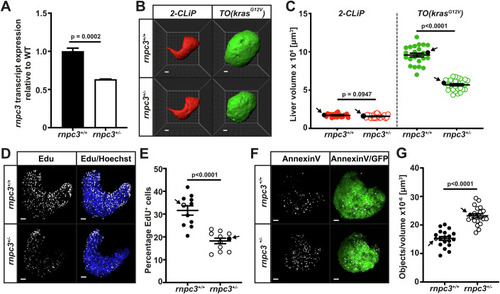
Heterozygous loss of ( |
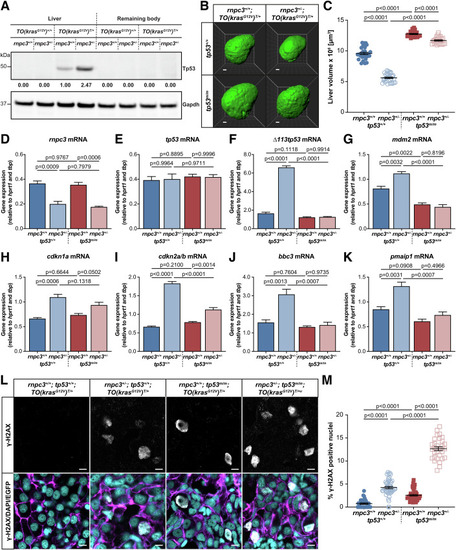
( |
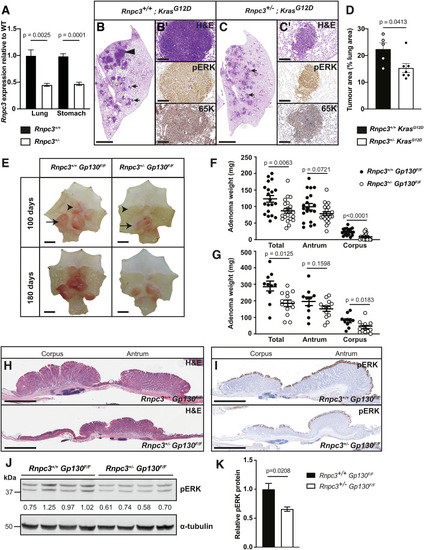
( |
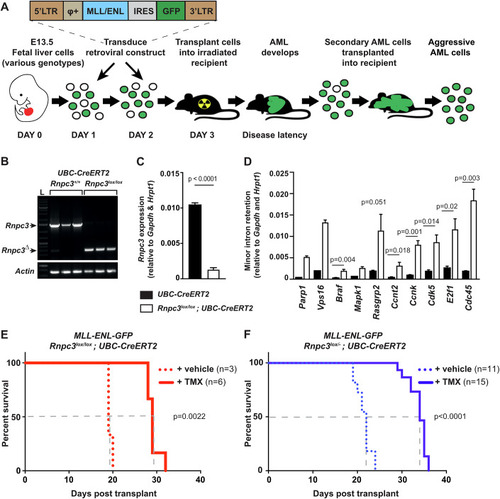
Disruption of the ( |
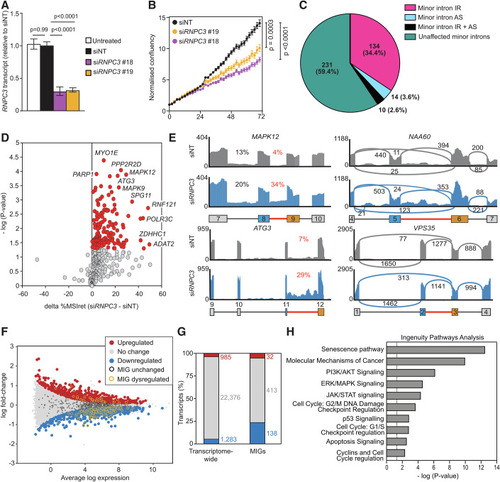
( |
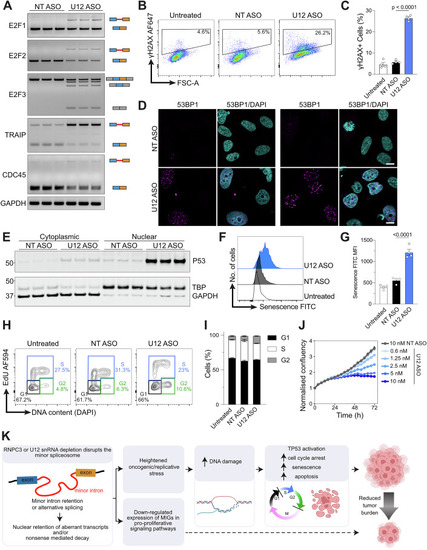
Minor class splicing knockdown induces DNA damage and cell cycle arrest in human cancer cell lines. ( |