|
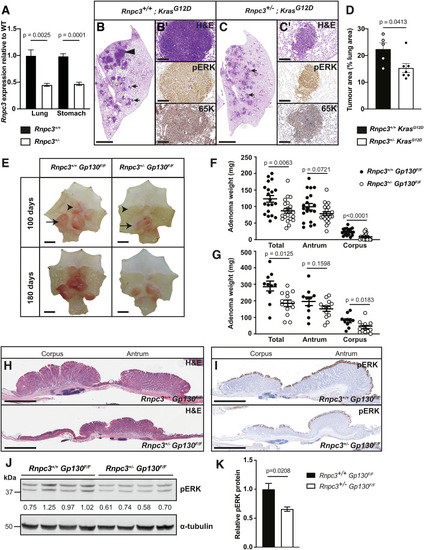
Rnpc3 heterozygosity reduces tumour burden in a mouse model of lung adenocarcinoma and gastric adenoma. (A) RT-qPCR analysis of Rnpc3 mRNA extracted from 160-day-old WT and Rnpc3 heterozygous mouse stomach and lung tissue (n = 4, 2 males and 2 females). Results are expressed as mean ± SEM. Significance was assessed using multiple unpaired t tests. (B, C) Representative hematoxylin and eosin-stained lung sections 180 days after intranasal administration of adenoviral Cre recombinase (AdCre). Arrows and arrowhead indicate foci of atypical adenomatous hyperplasia (AAH) and adenoma, respectively. These lesions are pERK and 65 K positive. Scale bar in (B, C) is 2 mm. Scale bar in (B′, C′) is 200 μm. (D) Quantification of hyperplasia in sections of lung, expressed as a percentage of total lung area. Results are expressed as mean ± SEM, n = 5 or 7 per genotype. Significance was assessed using a Student’s t test. (E) Representative adenomas in the corpus (arrowhead) and antral (arrow) regions of the glandular stomach of mice. Scale bar is 5 mm. (F) Total adenoma weight at 100 d of age, n = 20 or 21 per genotype. Data are expressed as mean ± SEM. (G) Total adenoma weight at 180 d of age, n = 10 or 14 per genotype. Data are expressed as mean ± SEM. Significance was assessed with a Student’s t test with Welch’s correction. (H) Histological sections of the glandular stomach stained with H&E at 100 d. (I) Immunocytochemical localization of pERK1/2 indicates active MAPK signalling at the luminal surface of adenomas in 100 d old Gp130F/F mice. Scale bar in (H, I) is 2 mm. (J) Western blot analysis of pERK1/2 proteins in antral adenomas from four individual mice/genotype at 100 d. Values shown are normalized by reference to the α-tubulin loading control and relative to Rnpc3+/+; Gp130F/F samples. (K) Quantification of pERK1/2 protein abundance shown in (J). Data are expressed as mean ± SEM, n = 4. Significance was assessed with a Student’s t test. Source data are available online for this figure.
|