|
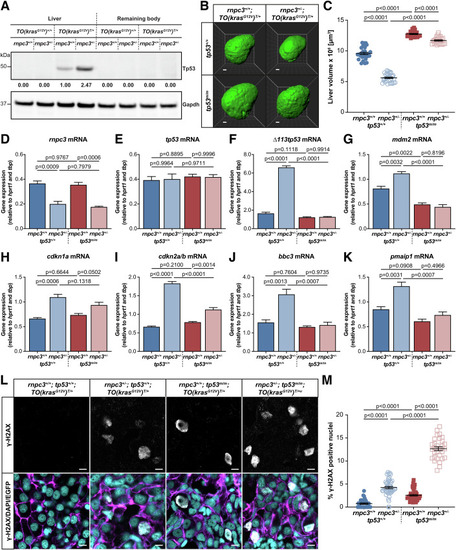
rnpc3 heterozygosity combines with krasG12V to activate a Tp53 DNA damage response that restricts tumour burden. (A) Tp53 Western blot in lysates of 7 dpf TO(krasG12V) larvae of the indicated rnpc3 genotype. Values shown are normalized by reference to the Gapdh loading control and compared with the Tp53 signal in lane 3, which was set at 1. (B) Representative three-dimensional reconstructions of 7 dpf TO(krasG12V)T/+ livers of the indicated rnpc3 and tp53 genotypes. Scale bar is 25 µm. (C) Impact of rnpc3 heterozygosity and homozygous tp53 mutation on liver volume in 7 dpf TO(krasG12V)T/+ larvae. Data represented as mean ± SEM, n = 28, 32, 27 and 24. Significance was tested using a one-way ANOVA with Tukey’s multiple comparisons test. Scale bar is 25 µm. (D–K) RT-qPCR analysis of gene expression in 7 dpf TO(krasG12V)T/+ dissected livers of the indicated rnpc3 and tp53 genotypes. Data are expressed as mean ± SEM, n = 3 biological replicates. (L) Representative Airyscan imaging of liver cryosections of liver from 7 dpf TO(krasG12V)T/+ larvae of the indicated rnpc3 and tp53 genotype stained with γ-H2AX antibody (white) marking DNA double-strand breaks, DAPI (cyan) marking DNA, and EGFP-KrasG12V (magenta) marking the cell membrane. Scale bar is 5 µm. (M) Quantification of the percentage of hepatocytes positive for γ-H2AX. Data are expressed as mean ± SEM, n = 32, 47, 46 and 30. Significance was tested using a one-way ANOVA with Tukey’s multiple comparisons test. Source data are available online for this figure.
|