|
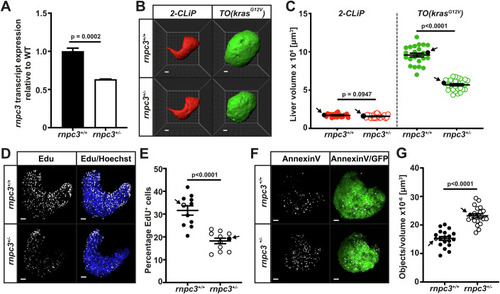
Heterozygous loss of rnpc3 reduces tumour burden in a krasG12V-driven zebrafish model of hepatocellular carcinoma (HCC). (A) RT-qPCR analysis of rnpc3 mRNA extracted from independent pools of rnpc3+/− larvae aged 7 days post-fertilization (dpf) compared to rnpc3+/+ larvae (n = 3 biological replicates). (B) Representative Imaris three-dimensional reconstructions of 2-CLiP and dox-treated TO(krasG12V)T/+ livers of 7 dpf larvae of the indicated rnpc3 genotype. Scale bar is 25 µm. (C) Liver volume in 2-CLiP (red symbols, n = 26 or n = 29) and TO(krasG12V) transgene (green circles, n = 24 or n = 28) zebrafish at 7 dpf. Black arrows on the graphs indicate the data points (black symbols) that correspond to the representative images shown in (B). (D, E) EdU (white dots) and Hoechst 33342-positive hepatocyte nuclei (n = 11) at 7 dpf. Black arrows on the graphs indicate the data points that correspond to the representative images shown in (D). Scale bar is 50 μm. (F, G) Foci of AnnexinV-mKate fluorescence in TO(krasG12V) livers (n = 19 and 20) at 7 dpf. Black arrows on the graphs indicate the data points that correspond to the representative images shown in (F). Scale bar is 50 μm. Data are represented as mean ± SEM. Significance was assessed using a Student’s t test, P < 0.05. Source data are available online for this figure.
|