IMAGE

Figure 6

ID
ZDB-IMAGE-250811-6
Source
Figures for Doggett et al., 2025
Image
Figure Caption

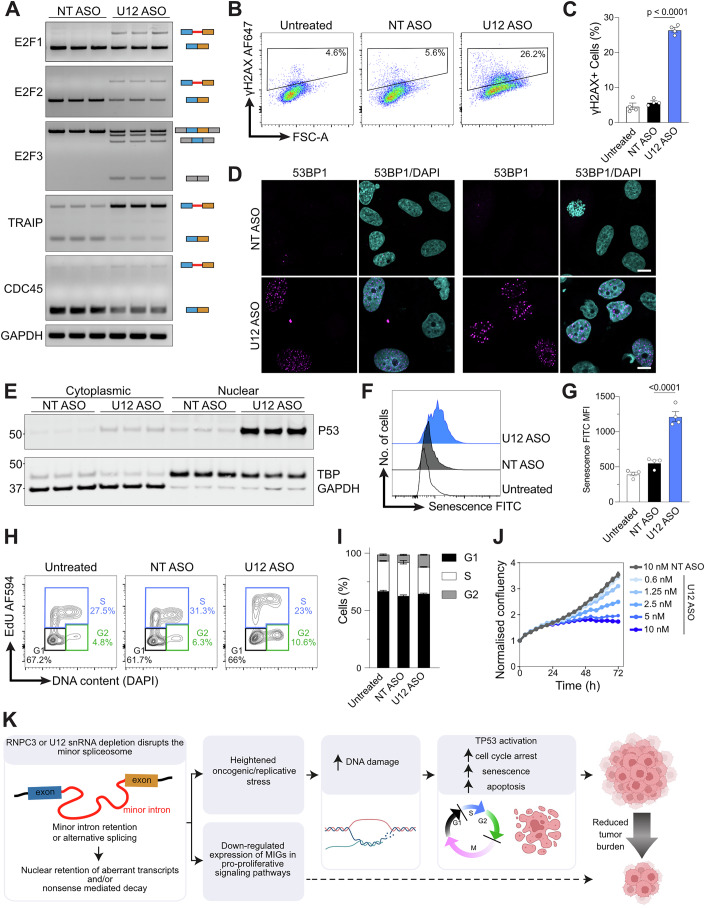
Figure 6 Minor class splicing knockdown induces DNA damage and cell cycle arrest in human cancer cell lines.

(A) RT-PCR analysis of cell cycle related MIG splicing changes in A549 cells after 72 h treatment with 10 nM ASO. Schematic depictions of the obtained amplicons are shown on the right with the minor intron in red and the upstream and downstream exons coloured blue and orange, respectively. Exons not separated by a minor intron are grey. (B) Representative FACS plots of yH2AX expression from A549 cells after 72 h treatment with 10 nM ASO. (C) Quantification of yH2AX FACS analysis. Data are represented by the mean ± SEM (n = 4). Significance was assessed by one-way ANOVA with Tukey’s multiple comparison test. (D) Two representative images of 53BP1 staining in A549 cells 72 h after 10 nM ASO treatment. Scale bar is 10 µm. (E) P53 immunoblot of nuclear and cytoplasmic fractions from A549 cells exposed to 10 nM ASO for 72 h (n = 3 biological replicates/condition). (F) Flow cytometry histograms of FITC senescence probe in A549 cells 72 h after 10 nM ASO treatment. (G) Quantification of senescence FACS analysis. MFI = median fluorescence intensity. Data are represented by mean ± SEM (n = 4). Significance was assessed by one-way ANOVA with Tukey’s multiple comparison test. (H) Representative FACS plots of cell cycle analysis from A549 cells after 72 h treatment with 10 nM ASO. Proliferating cells stained for incorporated EdU against total DNA content measured by DAPI. (I) Quantification of FACS cell cycle analysis. Data are represented by mean ± SEM (n = 4). Significance was assessed by one-way ANOVA with Tukey’s multiple comparison test. U12 ASO-treated samples were significantly different to NT ASO samples at two cell cycle stages: S P = 0.0009, G2 P < 0.0001. (J) Quantification of A549 cell growth over 72 h treatment across a titration of U12 ASO (0.625 nM–10 nM) compared to 10 nM non-targeted (NT) ASO. (K) Schematic diagram depicting the sequence of molecular and cellular events linking minor splicing disruption with reduced tumour burden. Data are represented as mean ± SEM (n = 4, 16 images per well, every hour). Source data are available online for this figure.

Acknowledgments
This image is the copyrighted work of the attributed author or publisher, and ZFIN has permission only to display this image to its users. Additional permissions should be obtained from the applicable author or publisher of the image. Full text @ EMBO Rep.