
- Title
-
Mutation of beta-tubulin 4B gene (TUBB4B) causes autosomal dominant retinitis pigmentosa with sensorineural hearing loss in a multigenerational family
- Authors
- Gregory-Evans, C.Y., Joe, A.W., Gregory-Evans, K.
- Source
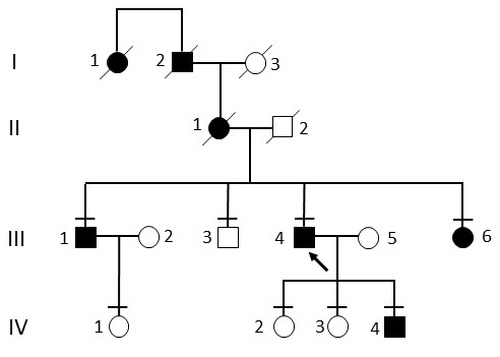
Four-generation family tree segregating autosomal dominant hearing loss and RP. The black symbols represent affected individuals and white symbols represent unaffected individuals. The arrow indicates the proband patient. The line above the symbols denotes family members who were examined. The first two generations were reported by proband as deaf-blind but were not examined or genetically tested. |
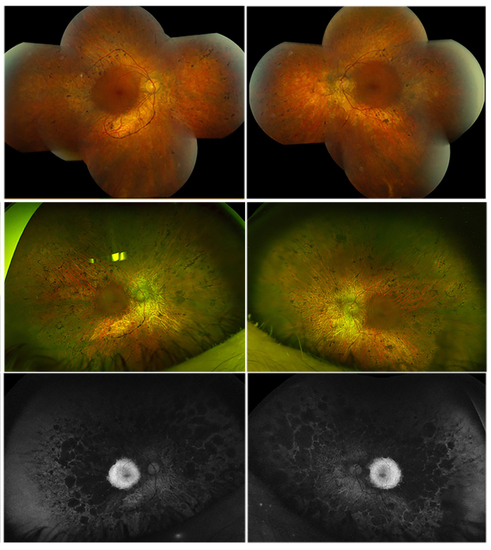
Color fundus and autofluorescence images from affected participant III-4. The upper row are color fundus images from age 51 years showing bone spicule retinal degeneration extending into the peripheral retina. The middle row shows color fundus images from age 62 years showing further extension of bone spicule retinal degeneration into the macular area and peripheral retina. Bottom row, autofluorescence imaging showing widespread hypo-autofluorescence plus hyper-autofluorescence at each macula. This would be described as typical retinitis pigmentosa. |
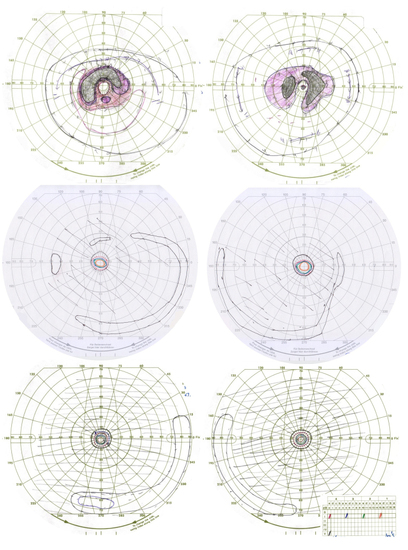
Deidentified Goldmann visual field results from affected participants III-1 and III-4. The upper row shows results from participant III-1 at 61 years of age showing dense mid-peripheral ring scotomas extending from 5 to 30 degrees. The middle row shows results from participant III-4 at 43 years old showing extensive field loss beyond the mid-periphery. The bottom row shows results from participant III-4 at 55 years of age showing further decline of far peripheral islands of vision. |
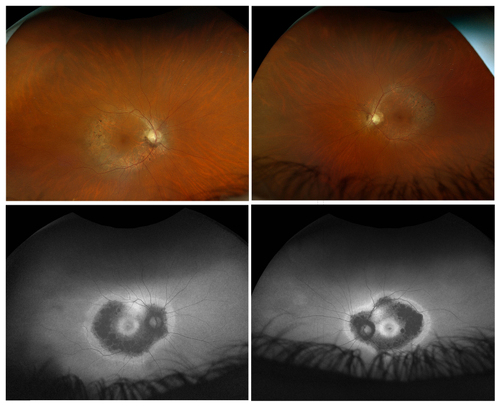
Color fundus and autofluorescence images from affected participant III-1. The upper row shows color fundus images from age 63 years showing bone spicule retinal degeneration confined to the near periphery. The bottom row shows autofluorescence imaging showing a hypo-autofluorescence band confined to the posterior pole plus hyper-autofluorescence beyond this area and at each macula. This would be described as pericentral retinitis pigmentosa. |
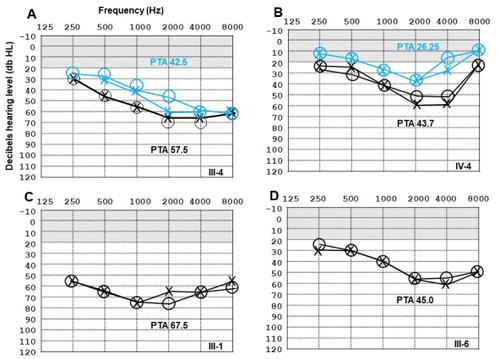
Audiograms for affected members of the family. Normal hearing range is highlighted by gray boxes (≤19.9 db HL) and specific family members denoted in the bottom right corner of the plot. (A) Hearing test in proband III-4. The X symbol is data from the left ear and the circle symbol is data from the right ear. Blue traces at age 28 and black traces at age 60 show progression of hearing loss over time. PTA scores are denoted in a corresponding color. (B) Hearing test in son of proband (IV-4). Blue traces at age 16 and black traces at age 22 show progression of hearing loss over time. (C) Hearing test in brother of proband (III-1). Audiogram traces at age 57 show severe hearing loss (PTA highest of all members tested). (D) Hearing test in sister of proband (III-6). Audiogram traces at age 51 correspond to lower hearing loss (PTA 45.0) compared to her two siblings (A and C). |
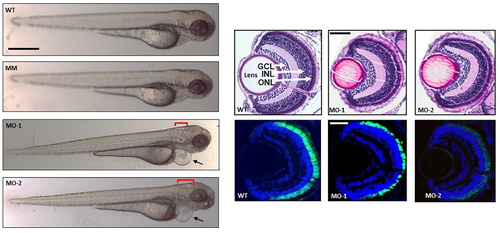
tubb4b loss-of-function phenotype in zebrafish observed at 72 hpf. The left panels show whole larvae morphology. MO-1 refers to tubb4b-specifc splice-blocking morpholino; MO-2, tubb4b-specifc translation-blocking morpholino; MM, mismatch control morpholino; WT refers to wild-type phenotype zebrafish. The arrow identifies cardiac edema and the red brackets shows hydrocephalus [204 ± 10 µm (standard error of the mean, n = 15) in MO-1 and 272 ± 12 µm (standard error of the mean, n = 12) in MO-2]. The size bar equals to 500 µm. The top row of the right panels show histologic sagittal sections through the retina and the bottom rows compare expression of EGFP (green) in cone photoreceptor cells in TαCP:EGFP transgenic fish with MO-1 or MO-2 treatment. GCL-ganglion cell layer; INL-inner nuclear layer; ONL-outer nuclear layer. The size bar equals 500 µm. PHENOTYPE:
|
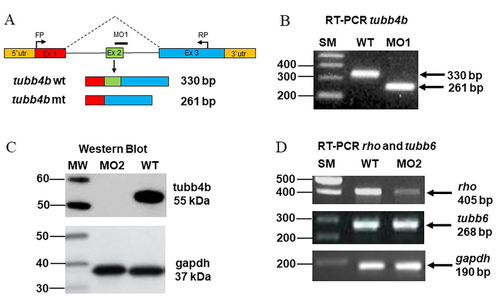
This figure shows confirmation of tubb4b morpholino knockdown. (A) Schematic representation of MO-1 splice-blocking that removes exon 2 (Ex 2) in the mutant (mt) mRNA transcript. FP refers to the forward primer; RP refers to the reverse primer; utr refers to the untranslated region. (B) Representative RT-PCR gel confirming reduction in size of tubb4b amplicon. MO1 refers to splice-blocking morpholino; SM refers to size marker; WT refers to the wild-type. (C) Representative image of a western blot of tubb4b protein in zebrafish injected with MO2 translation-blocking morpholino. The gel loading control is gapdh. MW refers to molecular weight size marker and WT refers to the wild-type. (D) Representative RT-PCR gels showing levels of rhodopsin (rho) and tubb6 transcripts with MO2 translation-blocking morpholino knockdown relative to gapdh expression. EXPRESSION / LABELING:
PHENOTYPE:
|

Unillustrated author statements PHENOTYPE:
|