
Fig. 6
- ID
- ZDB-IMAGE-250728-79
- Publication
- Gregory-Evans et al., 2025 - Mutation of beta-tubulin 4B gene (TUBB4B) causes autosomal dominant retinitis pigmentosa with sensorineural hearing loss in a multigenerational family
- All Figures
- Figures for Gregory-Evans et al., 2025
|
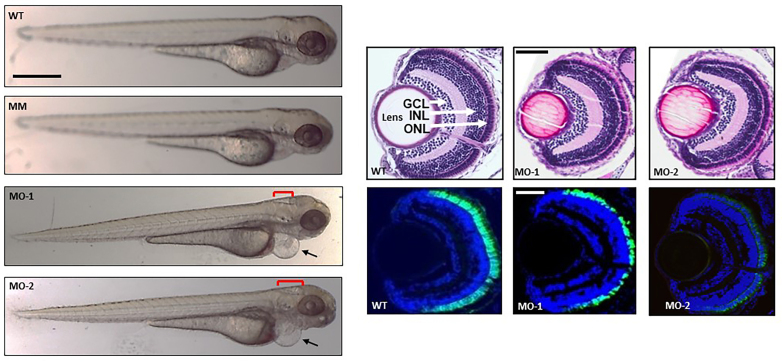
Fig. 6 tubb4b loss-of-function phenotype in zebrafish observed at 72 hpf. The left panels show whole larvae morphology. MO-1 refers to tubb4b-specifc splice-blocking morpholino; MO-2, tubb4b-specifc translation-blocking morpholino; MM, mismatch control morpholino; WT refers to wild-type phenotype zebrafish. The arrow identifies cardiac edema and the red brackets shows hydrocephalus [204 ± 10 µm (standard error of the mean, n = 15) in MO-1 and 272 ± 12 µm (standard error of the mean, n = 12) in MO-2]. The size bar equals to 500 µm. The top row of the right panels show histologic sagittal sections through the retina and the bottom rows compare expression of EGFP (green) in cone photoreceptor cells in TαCP:EGFP transgenic fish with MO-1 or MO-2 treatment. GCL-ganglion cell layer; INL-inner nuclear layer; ONL-outer nuclear layer. The size bar equals 500 µm.