
- Title
-
Multimodal Investigation of Angiogenesis and Its Prevention by Small Compounds in a Zebrafish Cancer Model
- Authors
- Andreana, M., Sentosa, R., Sturtzel, C., Pfister, M., Werkmeister, R., Schmitt, A., Traver, D., Leitgeb, R., Drexler, W., Distel, M., Unterhuber, A.
- Source
- Full text @ Adv Sci (Weinh)

Vascular abnormalities in RAS‐expressing zebrafish: a) Trunk region of a transgenic zebrafish ( |
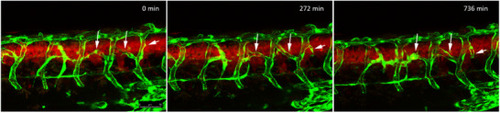
Hyperbranching in RAS‐expressing zebrafish. Stand stills from a time‐lapse movie starting around 57 hpf. Vascular sprouts develop from existing intersegmental vessels (arrows) and form new connections. Vessels shown in green and cells of the spinal cord expressing HRAS |

Overview of features that can be obtained in the context of vascular zebrafish imaging. The combination of OCT and fluorescence imaging allow high throughput screening for topological and vessel perfusion analysis, flow and vessel network visualization. Cancer development can be observed and compounds efficiency studies can be performed. By means of OCTA depth‐resolved flow network images are generated. |
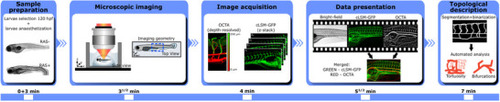
OCTA sequential imaging workflow. Sample preparation and selection are performed as first step in order to anaesthetize the larvae. Then, phytagel is used to fix the selected larvae in space for imaging over a glass dish filled with E3 medium. Next OCT depth resolved images and fluorescence GFP microscopy maps are recorded and OCTA images are calculated. Before any topological analysis can take place, images need to be co‐registered and a merged color‐coded image is created. The total imaging and analysis session take about 7 min per larvae. |
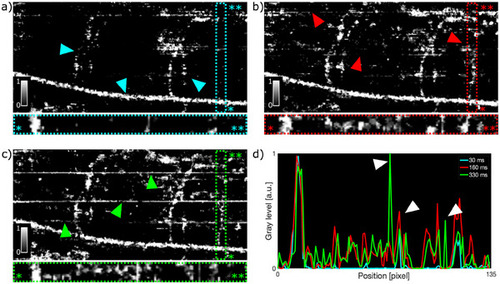
In vivo angiograms of the trunk of RAS+ zebrafish larvae at 120 hpf for different inter B‐scan times. a) B‐scan time of 30 ms. Cyan triangles indicate the position of DA and intersegmental vessels. b) 167 ms. Red triangles indicate the position of weak motion artifacts. c) 333 ms. Green triangles indicate the position of strong motion artifacts. d) Intensity profile of the slow flowing vessel in the framed area of a–c). White triangles highlight the motion artifacts for inter B‐scan time of 333 ms and 167 ms. The OCTA images in a–c) did not undergo data filtering. FOV is 487x190 µm2. |

Vasculature images of fli1:EGFP reporter, gata1:dsRed erythrocytes reporter and OCTA. The overlay of the images shows the origin of the three signals for a 120 hpf larva. |
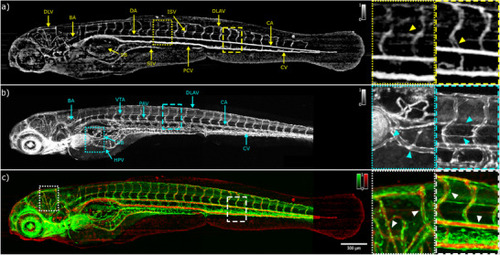
In vivo angiograms of RAS‐ zebrafish larvae at 120 hpf. a) en face label‐free OCTA image. The yellow triangle in the yellow dotted rectangle indicates the vertebral artery. The yellow triangle in the yellow dashed rectangle highlights the front and back intersegmental vessels. b) en face confocal GFP fluorescence image. The cyan triangles in the cyan dotted rectangle indicates the hepatic portal vein and pectoral artery location. The cyan triangles in the cyan dashed rectangle indicates the location of the parachordal vessel and the vertebral artery. c) merged image of the images in panel a) and b): red OCTA; green GFP fluorescence. The white triangles in the dotted and dashed rectangles show the complementary information of OCTA and cLSM. DLV, dorsal longitudinal vein; BA, basilar artery; DA, dorsal aorta; SIV, subintestinal vein; ISV, intersegmental vessels; PCV, posterior cardinal vein; DLAV, dorsal longitudinal anastomotic vessel; CA, caudal artery; CV, caudal vein; HPV, hepatic portal vein; SB, swim bladder; VTA, vertebral artery; PAV, parachordal vessel. |

In vivo angiograms of RAS+ zebrafish larvae at 120 hpf. a) en face label‐free OCTA image. The yellow triangles in the yellow dotted rectangle and yellow dashed rectangle highlight the misregulated flows. b) en face confocal GFP fluorescence image. The cyan triangles in the cyan dotted rectangle and cyan dashed rectangle show the uncontrolled growth of blood vessels. c) merged image of the images in panel a) and b): red OCTA; green GFP fluorescence. The white triangles in the dotted and dashed rectangles show the correlation between OCTA and cLSM information. DA, dorsal aorta; SIV, subintestinal vein; ISV, intersegmental vessels; PCV, posterior cardinal vein; DLAV, dorsal longitudinal anastomotic vessel; CA, caudal artery; CV, caudal vein; HPV, hepatic portal vein; SB, swim bladder; VTA, vertebral artery; PAV, parachordal vessel. |

Structural similarity index measure (SSIM) for 120 hpf zebrafish larvae. In vivo OCTA (a) and GFP images (b) of RAS‐ zebrafish larvae and corresponding SSIM results (c). In vivo OCTA (d) and GFP images (e) of RAS+ zebrafish larvae and corresponding SSIM results (f). The SSIM score for the RAS‐ and RAS+ zebrafish are 0.45 and 0.04, respectively. The dashed boxed areas highlight regular ISVs pattern for the RAS‐ case with local SSIM score of 0.33, and vessels looping for the RAS+ case with local SSIM score of 0.02. FOV is 607x394 µm2. |

Four most relevant topological metrics describing the vascular and flow network differences between RAS‐, RAS+ larvae. The results of treated larvae with lonafarnib at 1 µM and 3 µM concentrations and with trametinib at 100 nM are shown as well. Significant differences between RAS‐ and RAS+ groups are shown (ns non‐significant, * |