
|
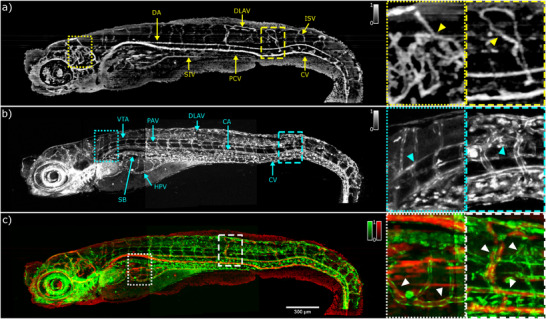
Figure 8
In vivo angiograms of RAS+ zebrafish larvae at 120 hpf. a) en face label‐free OCTA image. The yellow triangles in the yellow dotted rectangle and yellow dashed rectangle highlight the misregulated flows. b) en face confocal GFP fluorescence image. The cyan triangles in the cyan dotted rectangle and cyan dashed rectangle show the uncontrolled growth of blood vessels. c) merged image of the images in panel a) and b): red OCTA; green GFP fluorescence. The white triangles in the dotted and dashed rectangles show the correlation between OCTA and cLSM information. DA, dorsal aorta; SIV, subintestinal vein; ISV, intersegmental vessels; PCV, posterior cardinal vein; DLAV, dorsal longitudinal anastomotic vessel; CA, caudal artery; CV, caudal vein; HPV, hepatic portal vein; SB, swim bladder; VTA, vertebral artery; PAV, parachordal vessel.