
Image
|
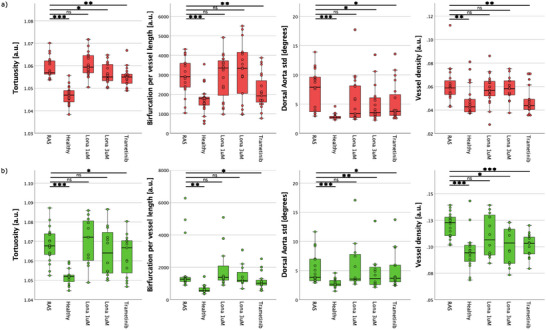
Figure Caption
Figure 10
Four most relevant topological metrics describing the vascular and flow network differences between RAS‐, RAS+ larvae. The results of treated larvae with lonafarnib at 1 µM and 3 µM concentrations and with trametinib at 100 nM are shown as well. Significant differences between RAS‐ and RAS+ groups are shown (ns non‐significant, *
Acknowledgments
This image is the copyrighted work of the attributed author or publisher, and
ZFIN has permission only to display this image to its users.
Additional permissions should be obtained from the applicable author or publisher of the image.
Full text @ Adv Sci (Weinh)