
Figure 7
- ID
- ZDB-FIG-250906-35
- Publication
- Andreana et al., 2025 - Multimodal Investigation of Angiogenesis and Its Prevention by Small Compounds in a Zebrafish Cancer Model
- Other Figures
- All Figure Page
- Back to All Figure Page
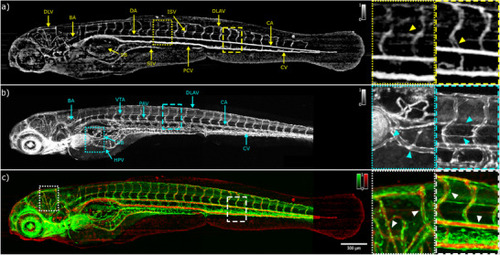
In vivo angiograms of RAS‐ zebrafish larvae at 120 hpf. a) en face label‐free OCTA image. The yellow triangle in the yellow dotted rectangle indicates the vertebral artery. The yellow triangle in the yellow dashed rectangle highlights the front and back intersegmental vessels. b) en face confocal GFP fluorescence image. The cyan triangles in the cyan dotted rectangle indicates the hepatic portal vein and pectoral artery location. The cyan triangles in the cyan dashed rectangle indicates the location of the parachordal vessel and the vertebral artery. c) merged image of the images in panel a) and b): red OCTA; green GFP fluorescence. The white triangles in the dotted and dashed rectangles show the complementary information of OCTA and cLSM. DLV, dorsal longitudinal vein; BA, basilar artery; DA, dorsal aorta; SIV, subintestinal vein; ISV, intersegmental vessels; PCV, posterior cardinal vein; DLAV, dorsal longitudinal anastomotic vessel; CA, caudal artery; CV, caudal vein; HPV, hepatic portal vein; SB, swim bladder; VTA, vertebral artery; PAV, parachordal vessel. |