
FIGURE
Figure 5
- ID
- ZDB-FIG-250906-33
- Publication
- Andreana et al., 2025 - Multimodal Investigation of Angiogenesis and Its Prevention by Small Compounds in a Zebrafish Cancer Model
- Other Figures
- All Figure Page
- Back to All Figure Page
Figure 5
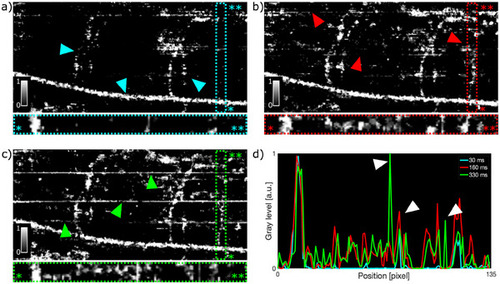
In vivo angiograms of the trunk of RAS+ zebrafish larvae at 120 hpf for different inter B‐scan times. a) B‐scan time of 30 ms. Cyan triangles indicate the position of DA and intersegmental vessels. b) 167 ms. Red triangles indicate the position of weak motion artifacts. c) 333 ms. Green triangles indicate the position of strong motion artifacts. d) Intensity profile of the slow flowing vessel in the framed area of a–c). White triangles highlight the motion artifacts for inter B‐scan time of 333 ms and 167 ms. The OCTA images in a–c) did not undergo data filtering. FOV is 487x190 µm2. |
Expression Data
Expression Detail
Antibody Labeling
Phenotype Data
Phenotype Detail
Acknowledgments
This image is the copyrighted work of the attributed author or publisher, and
ZFIN has permission only to display this image to its users.
Additional permissions should be obtained from the applicable author or publisher of the image.
Full text @ Adv Sci (Weinh)