
FIGURE
Figure 4
- ID
- ZDB-FIG-250906-32
- Publication
- Andreana et al., 2025 - Multimodal Investigation of Angiogenesis and Its Prevention by Small Compounds in a Zebrafish Cancer Model
- Other Figures
- All Figure Page
- Back to All Figure Page
Figure 4
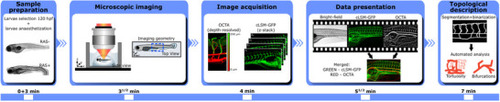
OCTA sequential imaging workflow. Sample preparation and selection are performed as first step in order to anaesthetize the larvae. Then, phytagel is used to fix the selected larvae in space for imaging over a glass dish filled with E3 medium. Next OCT depth resolved images and fluorescence GFP microscopy maps are recorded and OCTA images are calculated. Before any topological analysis can take place, images need to be co‐registered and a merged color‐coded image is created. The total imaging and analysis session take about 7 min per larvae. |
Expression Data
Expression Detail
Antibody Labeling
Phenotype Data
Phenotype Detail
Acknowledgments
This image is the copyrighted work of the attributed author or publisher, and
ZFIN has permission only to display this image to its users.
Additional permissions should be obtained from the applicable author or publisher of the image.
Full text @ Adv Sci (Weinh)