
- Title
-
Germline Disruption of Retinal Pigment Epithelium-Expressed Zebrafish rlbp1b-/- Results in Selective Dim Light Visual Behavior Deficits and Provides a Screening Platform for Evaluating the Pathogenicity of Human RLBP1 Variants
- Authors
- Fehilly, J.D., McCann, T., Ruddin, G., Kaylor, J.J., Grenville, H., Ward, R., Wynne, K., Sánchez, A.G., Strachan, E., Travis, G.H., Collery, R.F., Kennedy, B.N.
- Source
- Full text @ FASEB J.
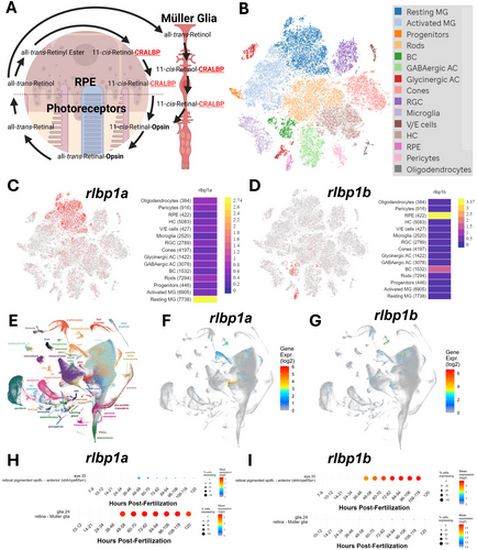
Zebrafish rlbp1a is expressed in the Müller glia and rlbp1b is expressed in the RPE. (A) Schematic diagram of the role of CRALBP in the visual cycle. Created using biorender.com. (B) tSNE clustering of scRNAseq data from [33]. (C) Expression of rlbp1a from the [33] dataset showing expression in Müller glia (red dots). (D) Expression of rlbp1b from the [33] dataset showing expression in the RPE (red dots). (E) UMAP projection of gene expression from the Daniocell database (daniocell.nichd.nih.gov). (F) UMAP projection of rlbp1a expression from Daniocell showing expression in Müller glia (blue to red colouration). (G) UMAP projection of rlbp1b expression showing expression in the RPE (blue to red colouration). (H) Time course of rlbp1a expression in the RPE and Müller glia during development from Daniocell. (I) Time course of rlbp1b expression in the RPE and Müller glia during development from Daniocell. |
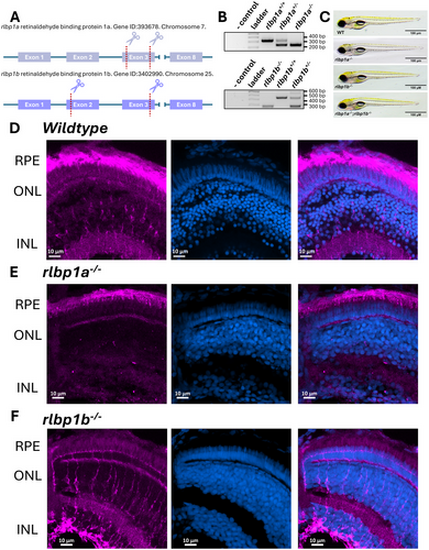
Generation and confirmation of zebrafish Cralbp CRISPR knockout lines. (A) Schematic of CRISPR approach used to generate rlbp1a and rlbp1b knockout lines. (B) Representative genotyping gels for PCR genotyping of rlbp1a and rlbp1b knockout lines where amplicons of 346 bp and 245 bp (rlbp1a) or 469 bp and 248 bp (rlbp1b) represent wildtype and deletion alleles, respectively. (C) Brightfield images of rlbp1a, or rlbp1b, and double knockout lines. (D) Cralbp immunostaining in 5 dpf larval zebrafish eyes showing expression in Müller glia and RPE. (E) Cralbp immunostaining in the rlbp1a knockout line showing loss of expression in Müller glia and robust expression in the RPE. (F) Cralbp immunostaining shows the opposite pattern in the rlbp1b knockout line with loss of expression in the RPE but persistent expression in the Müller glia. Magenta staining represents staining with the RLBP1 antibody (15356-1-AP), blue represents staining with Hoechst for nuclei. |
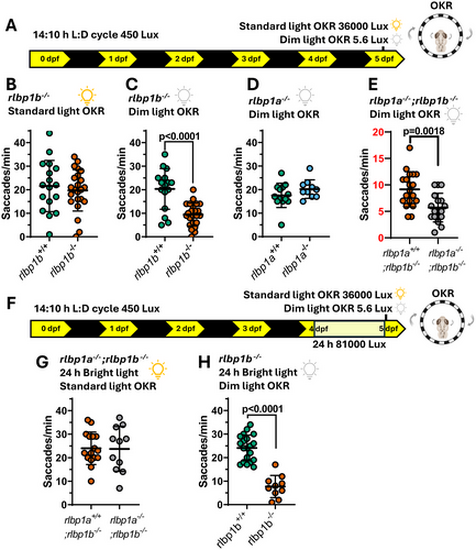
RPE expressed rlbp1b knockout larvae have an OKR visual behavior defect specifically in dim light. (A) Schematic showing raising conditions, followed by the type of OKR assay. (B) Standard light OKR assay showing no difference between rlbp1b−/− larvae with wildtype siblings. Four biological replicates n ≥ 17 larvae per group. (C) Dim light OKR assay comparing rlbp1b−/− larvae with WT siblings. Four biological replicates n ≥ 16 larvae per group. p < 0.0001 unpaired two tailed t-test. (D) No difference is seen in dim light OKR assays between rlbp1a−/− larvae with WT siblings. Three biological replicates n ≥ 10 larvae per group. (E) Dim light OKR assay showing a significant difference between rlbp1a−/−;rlbp1b−/− larvae and rlbp1b−/− larvae. Four biological replicates n ≥ 17 larvae per group. p = 0.0018 unpaired two tailed t-test. (F) Schematic showing raising conditions including 24 h bright light treatment starting on 99 hpf, followed by type of OKR assay. (G) 24 h bright light treatment followed by standard light OKR assay showing no difference between rlbp1a−/−;rlbp1b−/− larvae and rlbp1b−/− larvae. Three biological replicates n ≥ 11 larvae per group. (H) 24 h bright light treatment followed by dim light OKR assay showing a significant difference between WT siblings with rlbp1b−/− larvae. Three biological replicates n ≥ 10 larvae per group. p < 0.0001 unpaired two tailed t-test. All OKRs were carried out with a 0.02 CPD drum on < 131 hpf larvae. All graphs show mean ± standard deviation. |
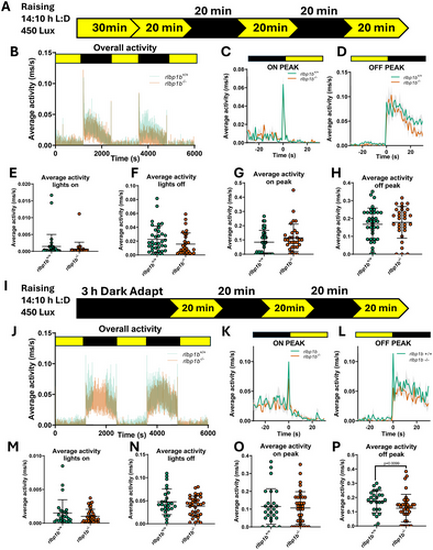
rlbp1b knockout larvae have a deficit in VMR behavior when dark adapted. (A) Schematic of raising and experimental parameters for standard VMR assays using < 131 hpf rlbp1b−/− knockout zebrafish larvae. (B) Graph showing the overall average activity of rlbp1b+/+ and rlbp1b−/− larvae (n ≥ 30 larvae per group, three biological replicates). (C) Average activity from 25 s before and after the both lights on transitions. (D) Average activity from 25 s before and after both lights off transitions. (E) Average activity per larvae during light periods of the experiment. (F) Average activity per larvae during dark periods of the experiment. (G) Average peak activity in the 5 s following both lights on transitions per larvae. (H) Average peak activity in the 5 s following both lights off transitions per larvae. (I) Schematic of raising and experimental parameters for 3 h dark adapted VMR assays using < 131 hpf rlbp1b−/− knockout zebrafish larvae. (J) Graph showing the overall average activity of rlbp1b+/+ and rlbp1b−/− larvae (n ≥ 36 larvae per group, three biological replicates). (K) Average activity from 25 s before and after both lights on transitions. (L) Average activity from 25 s before and after both lights off transitions. (M) Average activity per larvae during light periods of the experiment. (N) Average activity per larvae during dark periods of the experiment. (O) Average peak activity in the 5 s following both lights on transitions per larvae. (P) Average peak activity in the 5 s following both lights off transitions per larvae. p = 0.0099, Mann–Whitney U test. All graphs show mean ± standard deviation except C, D, K, L which show the standard error of the mean. |
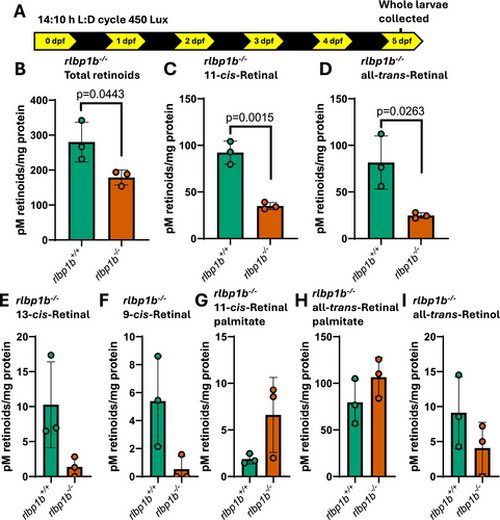
rlbp1b knockout larvae have altered retinoid metabolism. (A) Schematic of experimental conditions where 50 whole larvae were collected at midday day 5 following standard raising conditions. Following this, retinoids were profiled by HPLC. All graphs represent three biological replicates for each sample. (B) Total retinoid levels are significantly reduced in rlbp1b knockout larvae (p = 0.0443, two tailed t-test). (C) 11-cis-retinal levels are significantly reduced in rlbp1b knockout larvae (p = 0.0015, two tailed t-test). (D) all-trans-retinal levels are significantly reduced in rlbp1b knockout larvae (p = 0.0263, two tailed t-test). (E, F) levels of less abundant 13-cis-retinal and 9-cis-retinal do not show any significant change in rlbp1b knockout larvae. (G, H) levels of retinal esters do not show any significant change in rlbp1b knockout larvae. (I) There is no significant change in levels of all-trans-retinol in rlbp1b knockout larvae. All graphs show mean ± standard deviation. |
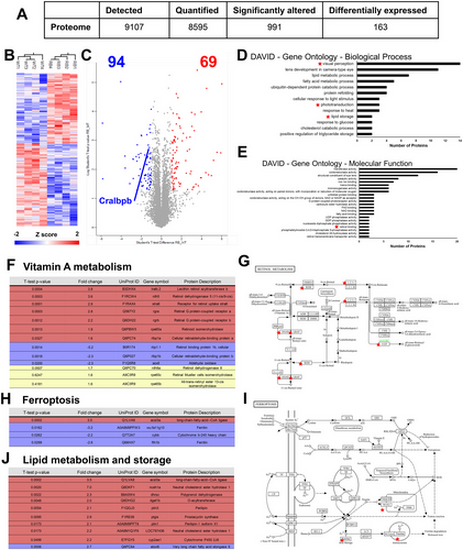
Proteomic profile of rlbp1b knockout zebrafish eyes shows defects in proteins related to vitamin A metabolism, ferroptosis, and lipid metabolism/storage. (A) Summary statistics of differentially expressed proteins identified in this experiment. (B) Heatmap showing clustering of differentially expressed proteins in wildtype and rlbp1b knockout zebrafish eyes. (C) Volcano plot showing differentially expressed upregulated and downregulated proteins in rlbp1b knockout zebrafish eyes. (D) DAVID gene ontology enrichment analysis showing enriched ‘Biological Process’ terms in this dataset. (E) DAVID gene ontology enrichment analysis showing enriched ‘Molecular function’ terms in this dataset. (F) Selected vitamin A metabolism proteins that are differentially expressed (Red—upregulated, Blue—downregulated) in the rlbp1b knockout or not statistically different in the rlbp1b knockout. (G) KEGG pathway for Retinol metabolism with differentially expressed proteins highlighted. (H) Differentially expressed Ferroptosis proteins in this dataset. (I) KEGG pathway for Ferroptosis with differentially expressed genes highlighted. (J) Differentially expressed Lipid metabolism and storage genes in this dataset. |
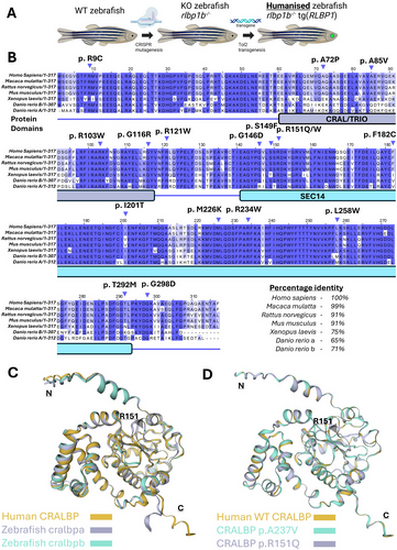
Human RLBP1 represents a good target for a humanized zebrafish approach. (A) Schematic of the humanized zebrafish lines approach used in this study. (B) Alignment of Cralbp protein sequences using the TCoffee alignment tool. Domains mapped to these sequences manually from the NCBI conserved domain search tool. Pathogenic mutations in CRALBP are taken from [6]. (C) Structural model of human CRALBP and zebrafish paralogs created using the SWISS-MODEL web tool. (D) Structural model of human CRALBP and missense variants p.R151Q and p.A237V using the SWISS-MODEL web tool. |
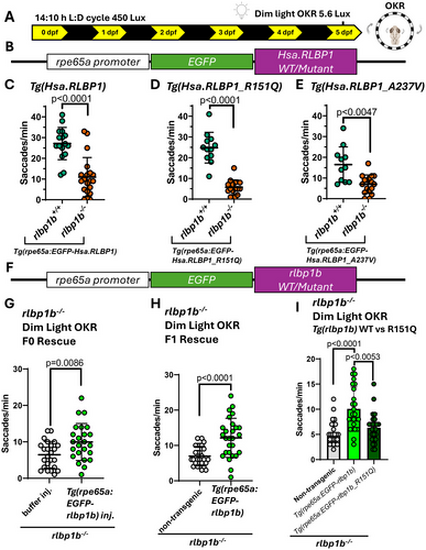
The EGFP-tagged zebrafish rlbp1b gene but not the human RLBP1 gene can rescue the dim light OKR in rlbp1b knockout larvae. (A) Schematic of standard raising and dim light OKR approach used to assess rescue in humanized zebrafish lines. (B) Schematic of expression vectors used to create humanized EGFP-tagged RLBP1 zebrafish lines used in this study. (C) The EGFP-tagged human RLBP1 gene is not sufficient to rescue the dim light OKR phenotype in rlbp1b knockout larvae (p < 0.0001, Mann Whitney test). Three biological replicates n ≥ 16 larvae per group. (D, E) The expression of missense RLBP1 disease variants p.R151Q and p.A237V do not cause any additional impairment of the dim light OKR response in rlbp1b knockout larvae. p.R151Q 3 biological replicates n ≥ 12 larvae per group (p < 0.0001, two tailed t-test). p.A237V 3 biological replicates n ≥ 11 larvae per group (p < 0.0047, Welch's t-test). (F) Schematic of expression vectors used to create zebrafish lines expressing EGFP-tagged rlbp1b used in this study. (G) F0 rescue of the dim light OKR phenotype using the tg(rpe65a:eGFP-rlbp1b) transgene in the rlbp1b knockout larvae. Three biological replicates n = 24 rlbp1b−/− larvae per group (p = 0.0086, two tailed t-test). (H) Rescue of the dim light OKR phenotype in F1 larvae stably expressing tg(rpe65a:eGFP-rlbp1b). Three biological replicates n = 27 rlbp1b−/− larvae per group (p < 0.0001, two tailed t-test). (I) Stable expression of the tg(rpe65a:eGFP-rlbp1bp.R151Q) fails to rescue the dim light OKR phenotype in rlbp1b knockout larvae. No significant difference between non-transgenic larvae and larvae with the tg(rpe65a:eGFP-rlbp1bp.R151Q) transgene. Significant difference between larvae with the wildtype vs. p.R151Q mutant transgene (p < 0.0053, Kruskal–Wallis test). Three biological replicates n = 25 rlbp1b−/− larvae per group. All graphs show mean ± standard deviation. |
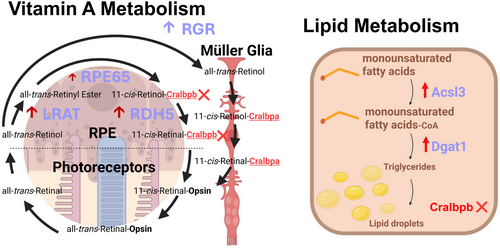
Schematic of key upregulated genes in vitamin A metabolism and lipid metabolism pathways in the rlbp1b knockout. |