
|
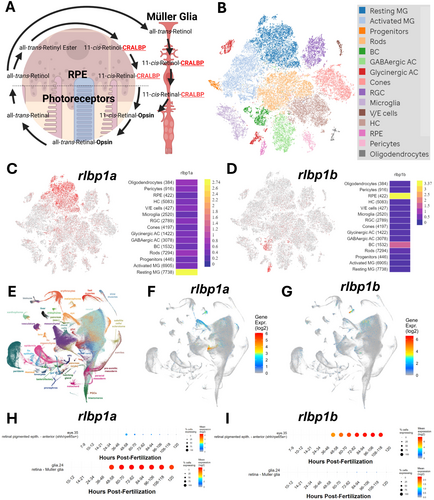
Fig. 1 Zebrafish rlbp1a is expressed in the Müller glia and rlbp1b is expressed in the RPE. (A) Schematic diagram of the role of CRALBP in the visual cycle. Created using biorender.com. (B) tSNE clustering of scRNAseq data from [33]. (C) Expression of rlbp1a from the [33] dataset showing expression in Müller glia (red dots). (D) Expression of rlbp1b from the [33] dataset showing expression in the RPE (red dots). (E) UMAP projection of gene expression from the Daniocell database (daniocell.nichd.nih.gov). (F) UMAP projection of rlbp1a expression from Daniocell showing expression in Müller glia (blue to red colouration). (G) UMAP projection of rlbp1b expression showing expression in the RPE (blue to red colouration). (H) Time course of rlbp1a expression in the RPE and Müller glia during development from Daniocell. (I) Time course of rlbp1b expression in the RPE and Müller glia during development from Daniocell.