
- Title
-
Swimming Training in a T2DM Zebrafish Model Restores Mitochondrial Function to Alleviate Anxiety-Like Behaviors and Metabolic Dysregulation
- Authors
- Fang, Y., Qu, J., Zhao, J., Qu, L., Wang, L., Luo, C., Yang, Q., Wu, W., Sun, D., He, D.
- Source
- Full text @ Front Biosci (Landmark Ed)

Schematic representation of the study design and underlying mechanisms. (A) Experimental timeline of zebrafish swimming training. (B) Patients with type 2 diabetes mellitus (T2DM) show insulin resistance, hyperglycemia and metabolic abnormalities, causing the liver to synthesize more lipoprotein and cholesterol. (C) T2DM patients also display mitochondrial dysfunction and oxidative stress, which further interfere with lipid and glutamine synthesis pathways and inhibit synthesis of the antioxidant reduced glutathione (GSH). T2DM can also lead to lipid metabolism disorders and inflammation, as well as increase the risk of anxiety symptoms. (D) Through swimming training (ST), zebrafish may undergo gradual recovery of liver mitochondrial function, thereby reconstructing the balance between oxidative stress and antioxidation, and altering mood. LDL, low-density lipoprotein; HDL, high-density lipoprotein cholesterol; ROS, reactive oxygen species; SOD, superoxide dismutase. |
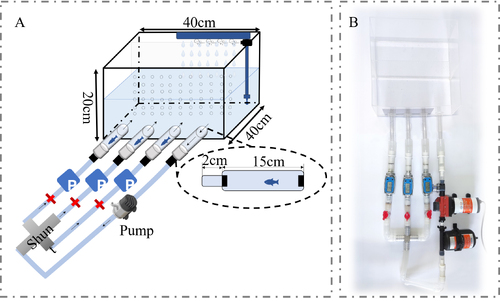
Zebrafish aerobic exercise equipment. The arrow indicates the direction of water flow. (A) Diagram of the device design. (B) Photograph of the actual device. |
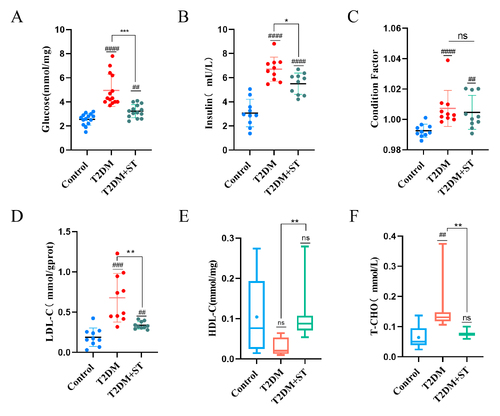
T2DM zebrafish groups display different degrees of blood sugar and blood lipid metabolism disorders. (A) Blood sugar. (B) Insulin. (C) Condition factor (CF). (D) Low-density lipoprotein cholesterol (LDL-C). (E) High-density lipoprotein cholesterol (HDL-C). (F) Total cholesterol (T-CHO). # denotes a significant difference between the control group and the other groups, while * denotes a significant difference between the T2DM and T2DM+ST groups. Significance thresholds are marked as follows: ns p > 0.05, p < 0.05 (*), p < 0.01 (** or ##), p < 0.001 (*** or ###), and p < 0.0001 (####). |
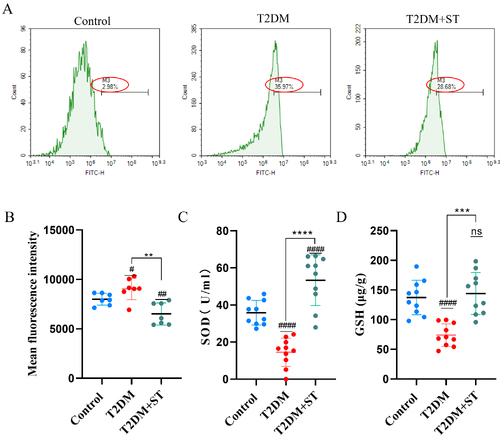
High glucose induces the generation of oxidative stress. (A) Scatter plot of 2′,7′-Dichlorodihydrofluorescein (DCFH)-labeled cell clusters in zebrafish liver. (B) Fluorescence intensity analysis of DCFH. (C) Comparative analysis of superoxide dismutase (SOD) content. (D) Comparative analysis of GSH content. # denotes a significant difference between the control group and the other groups, while * denotes a significant difference between the T2DM and T2DM+ST groups. Significance thresholds are marked as follows: ns p > 0.05, p < 0.05 (#), p < 0.01 (** or ##), p < 0.001 (***), and p < 0.0001 (**** or ####). |
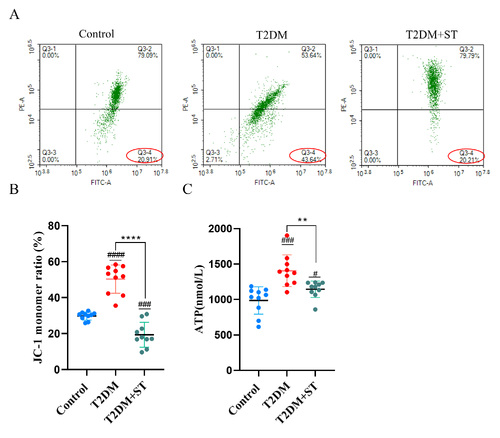
Mitochondrial membrane potential and adenosine triphosphate (ATP) levels in zebrafish liver tissue. (A) Scatter plot of cell clusters labeled with 5,5′,6,6′-Tetrachloro-1,1′,3,3′-tetraethylbenzimidazolylcarbocyanine iodide (JC-1) in zebrafish liver. JC-1 staining was used to evaluate the mitochondrial membrane potential (MMP). (B) Fluorescence intensity analysis of JC-1. (C) Comparative analysis of ATP content. # denotes a significant difference between the control group and the other groups, while * denotes a significant difference between the T2DM and T2DM+ST groups. Significance thresholds are marked as follows: p < 0.05 (#), p < 0.01 (**), p < 0.001 (###), and p < 0.0001 (**** or ####). |
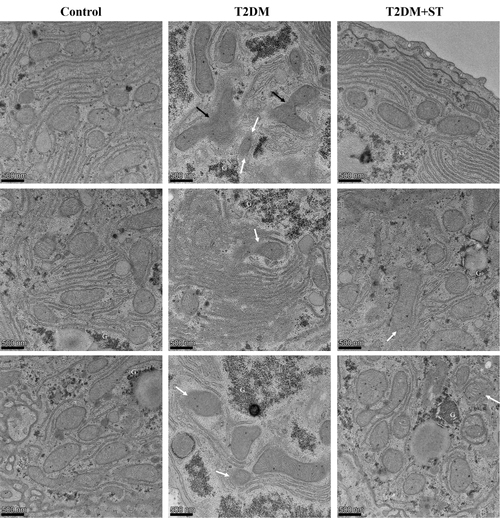
Transmission electron micrographs of liver mitochondria in zebrafish. G represents accumulated glycogen in the liver. The black arrows indicate the morphology of mitochondrial fusion/fission, while the white arrows indicate damage to the mitochondrial double membrane structure. Scale bar: 500 nm. |
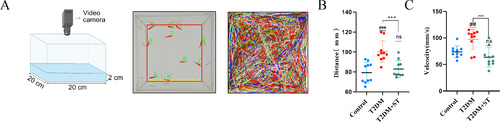
Shoal test results. Ten zebrafish in each group participated in the test, with the trajectories represented by different colors. (A) Schematic diagram of the shoaling test (Created using BioRender.com) and zebrafish trajectory. (B) The average distance between zebrafish in the fish shoal test. (C) The average speed of zebrafish in the shoal test. # denotes a significant difference between the control group and the other groups, while * denotes a significant difference between the T2DM and T2DM+ST groups. Significance thresholds are marked as follows: ns p > 0.05, p < 0.01 (##), p < 0.001 (*** or ###). |
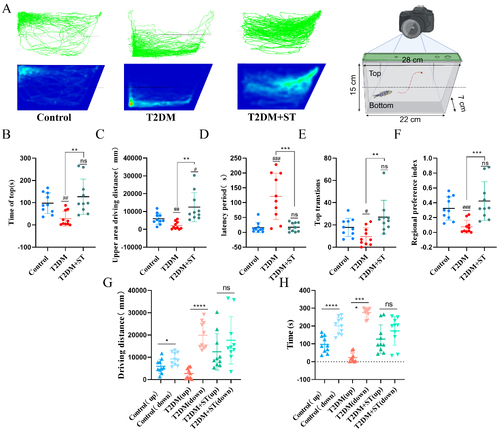
Novel tank test (NTT) results. Ten zebrafish in each group participated in the test. (A) The movement trajectory of zebrafish and a diagram of the test device (Created using BioRender.com). (B) Swimming time in the top region. (C) Driving distance in the top region. (D) Latency (time required for first access to the top). (E) The number of shuttles between the top and bottom region. (F) Preference of zebrafish for top region. (G) Comparison of the distance traveled by each zebrafish in the top and bottom regions. (H) Comparison of time spent in the top and bottom regions for each zebrafish. # denotes a significant difference between the control group and the other groups, while * denotes a significant difference between the T2DM and T2DM+ST groups. Significance thresholds are marked as follows: ns p > 0.05, p < 0.05 (* or #), p < 0.01 (** or ##), p < 0.001 (*** or ###), and p < 0.0001 (****). |