
|
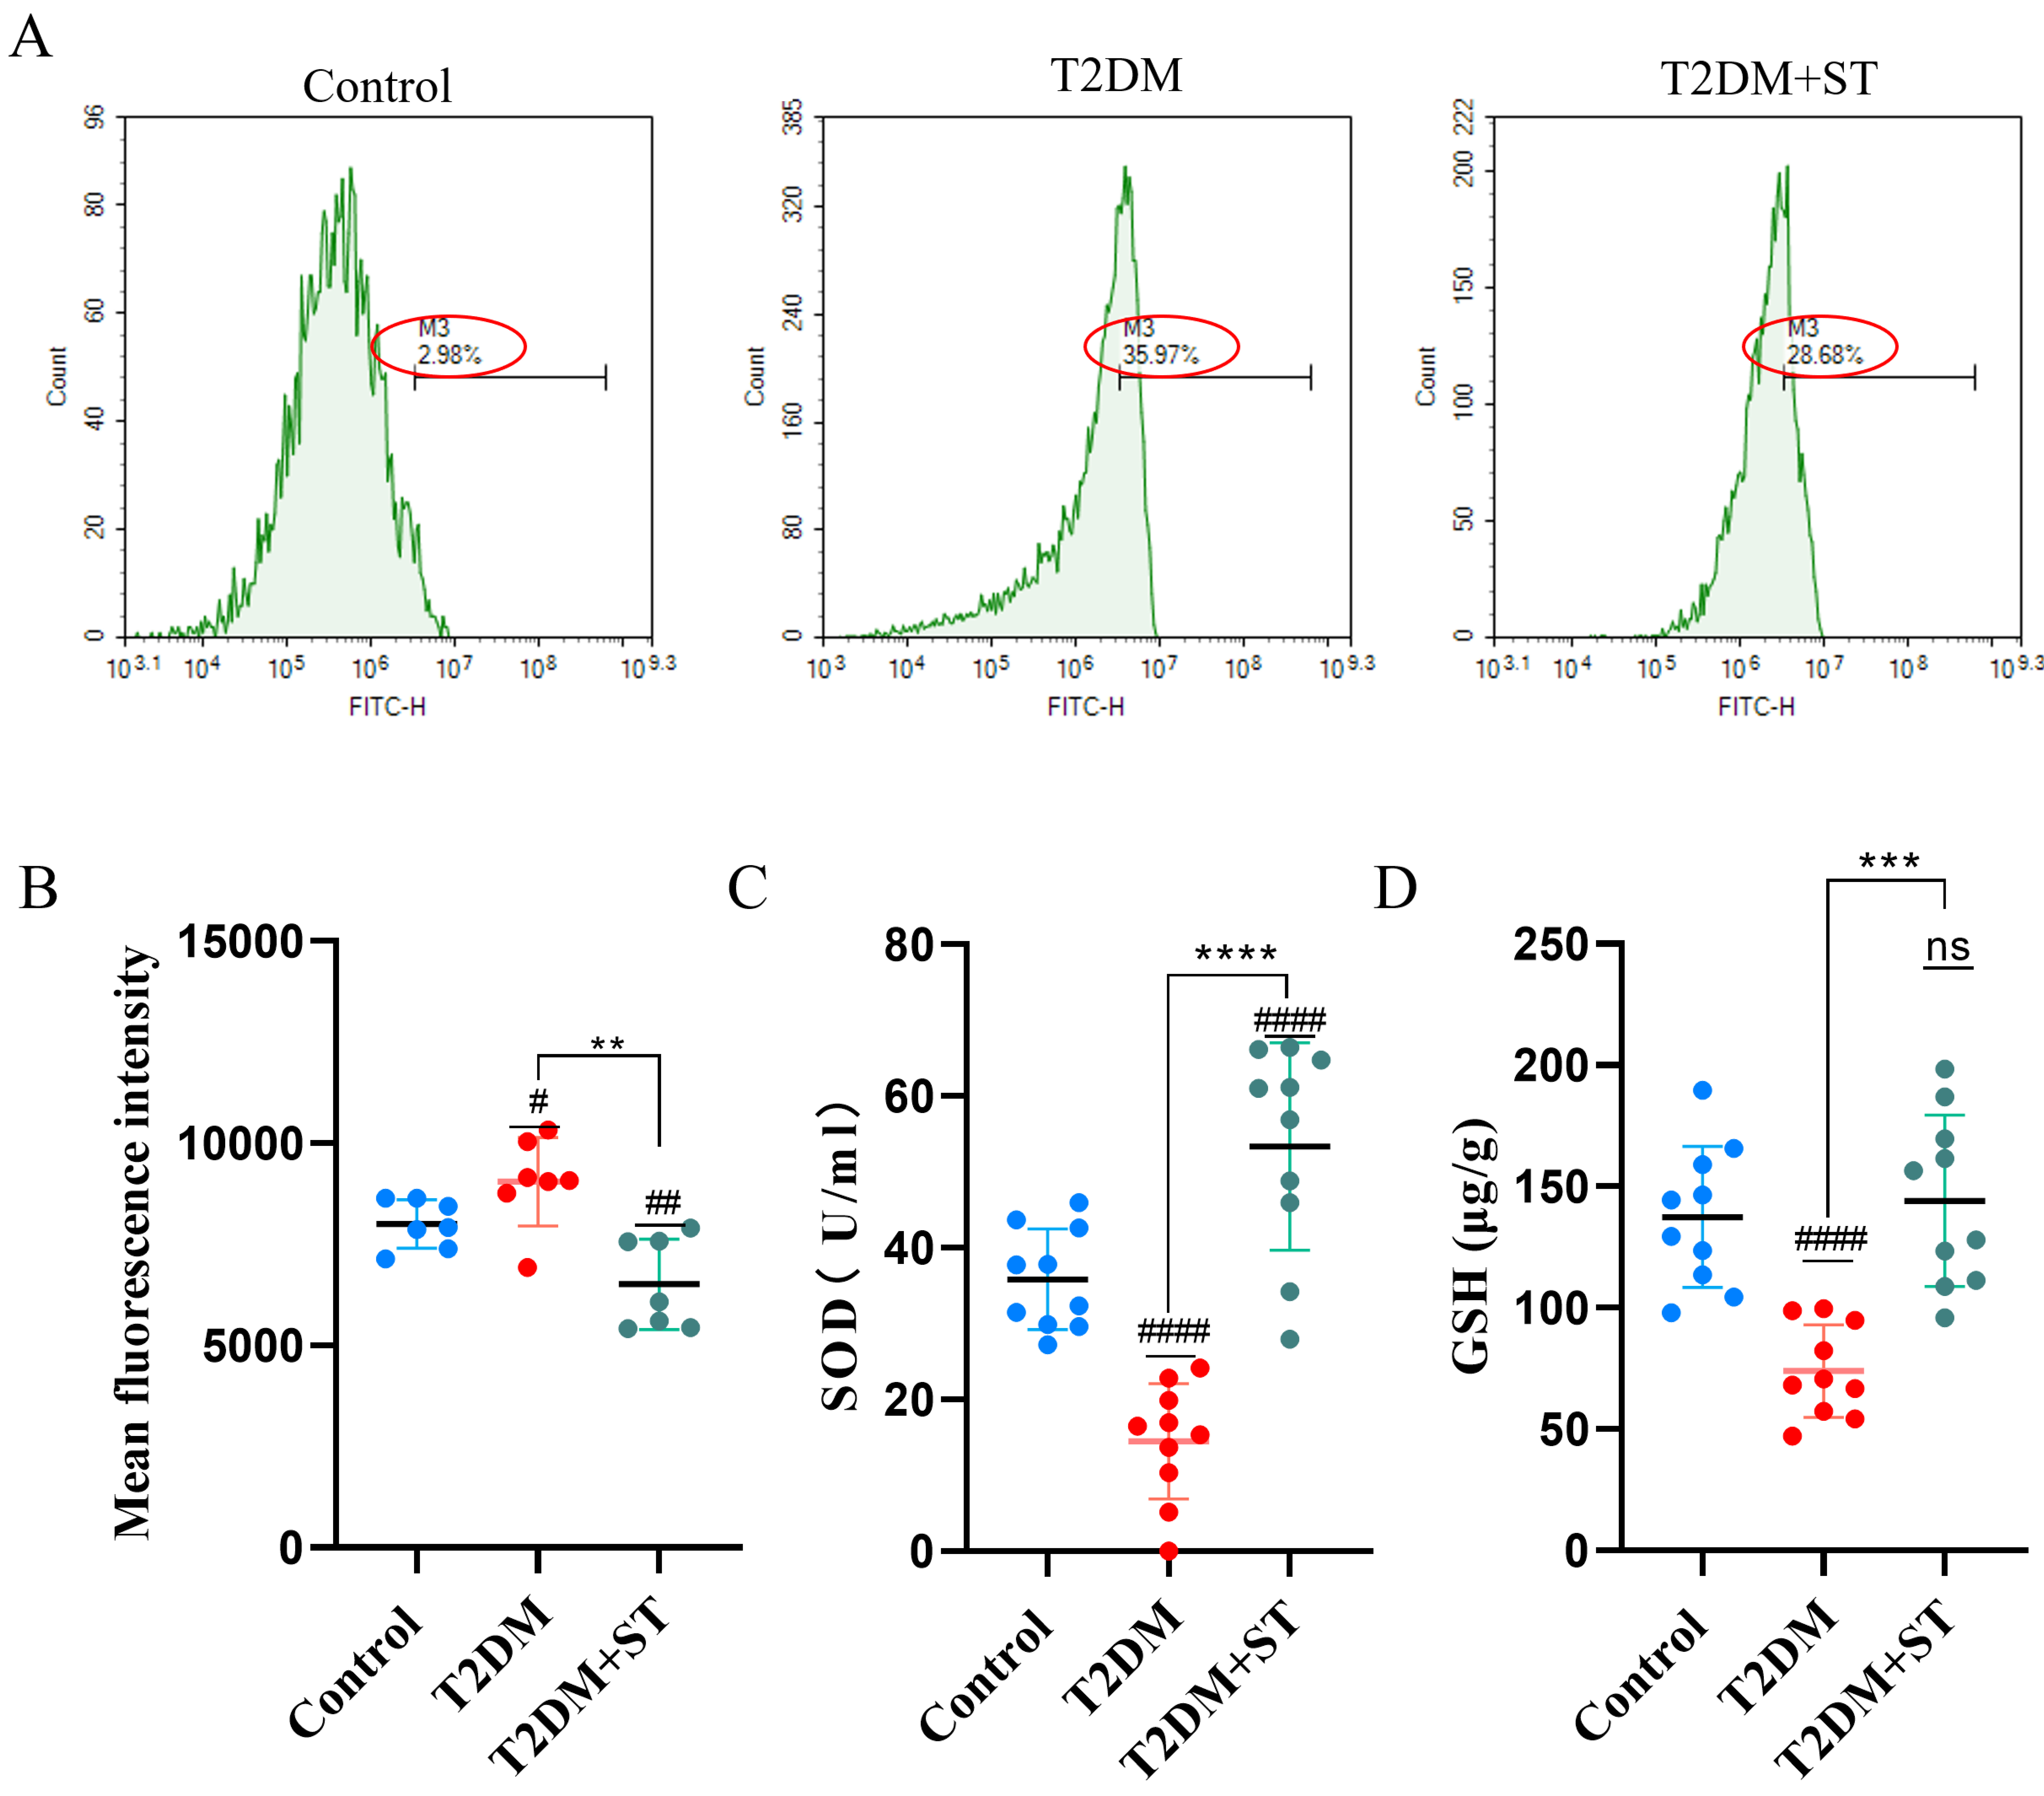
Fig. 4 High glucose induces the generation of oxidative stress. (A) Scatter plot of 2′,7′-Dichlorodihydrofluorescein (DCFH)-labeled cell clusters in zebrafish liver. (B) Fluorescence intensity analysis of DCFH. (C) Comparative analysis of superoxide dismutase (SOD) content. (D) Comparative analysis of GSH content. # denotes a significant difference between the control group and the other groups, while * denotes a significant difference between the T2DM and T2DM+ST groups. Significance thresholds are marked as follows: ns p > 0.05, p < 0.05 (#), p < 0.01 (** or ##), p < 0.001 (***), and p < 0.0001 (**** or ####).