
Fig. 7
- ID
- ZDB-FIG-250630-69
- Publication
- Fang et al., 2025 - Swimming Training in a T2DM Zebrafish Model Restores Mitochondrial Function to Alleviate Anxiety-Like Behaviors and Metabolic Dysregulation
- Other Figures
- All Figure Page
- Back to All Figure Page
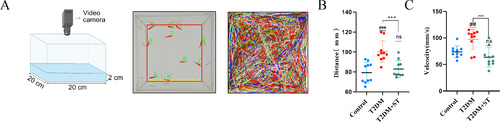
Shoal test results. Ten zebrafish in each group participated in the test, with the trajectories represented by different colors. (A) Schematic diagram of the shoaling test (Created using BioRender.com) and zebrafish trajectory. (B) The average distance between zebrafish in the fish shoal test. (C) The average speed of zebrafish in the shoal test. # denotes a significant difference between the control group and the other groups, while * denotes a significant difference between the T2DM and T2DM+ST groups. Significance thresholds are marked as follows: ns p > 0.05, p < 0.01 (##), p < 0.001 (*** or ###). |