
FIGURE
Fig. 3
- ID
- ZDB-FIG-250630-65
- Publication
- Fang et al., 2025 - Swimming Training in a T2DM Zebrafish Model Restores Mitochondrial Function to Alleviate Anxiety-Like Behaviors and Metabolic Dysregulation
- Other Figures
- All Figure Page
- Back to All Figure Page
Fig. 3
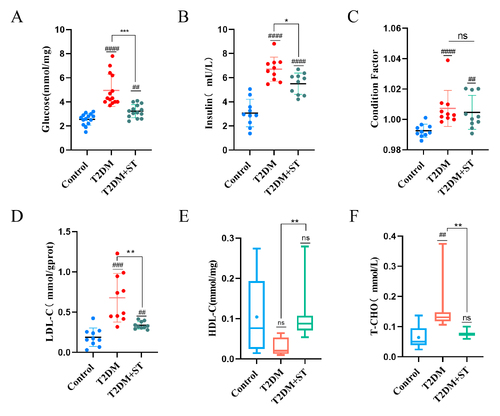
T2DM zebrafish groups display different degrees of blood sugar and blood lipid metabolism disorders. (A) Blood sugar. (B) Insulin. (C) Condition factor (CF). (D) Low-density lipoprotein cholesterol (LDL-C). (E) High-density lipoprotein cholesterol (HDL-C). (F) Total cholesterol (T-CHO). # denotes a significant difference between the control group and the other groups, while * denotes a significant difference between the T2DM and T2DM+ST groups. Significance thresholds are marked as follows: ns p > 0.05, p < 0.05 (*), p < 0.01 (** or ##), p < 0.001 (*** or ###), and p < 0.0001 (####). |
Expression Data
Expression Detail
Antibody Labeling
Phenotype Data
Phenotype Detail
Acknowledgments
This image is the copyrighted work of the attributed author or publisher, and
ZFIN has permission only to display this image to its users.
Additional permissions should be obtained from the applicable author or publisher of the image.
Full text @ Front Biosci (Landmark Ed)