
Fig. 5
- ID
- ZDB-FIG-250630-67
- Publication
- Fang et al., 2025 - Swimming Training in a T2DM Zebrafish Model Restores Mitochondrial Function to Alleviate Anxiety-Like Behaviors and Metabolic Dysregulation
- Other Figures
- All Figure Page
- Back to All Figure Page
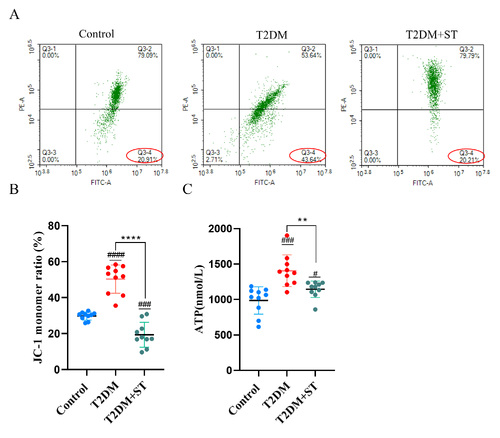
Mitochondrial membrane potential and adenosine triphosphate (ATP) levels in zebrafish liver tissue. (A) Scatter plot of cell clusters labeled with 5,5′,6,6′-Tetrachloro-1,1′,3,3′-tetraethylbenzimidazolylcarbocyanine iodide (JC-1) in zebrafish liver. JC-1 staining was used to evaluate the mitochondrial membrane potential (MMP). (B) Fluorescence intensity analysis of JC-1. (C) Comparative analysis of ATP content. # denotes a significant difference between the control group and the other groups, while * denotes a significant difference between the T2DM and T2DM+ST groups. Significance thresholds are marked as follows: p < 0.05 (#), p < 0.01 (**), p < 0.001 (###), and p < 0.0001 (**** or ####). |