
- Title
-
Direct regulation of Per2 by Roraa: insights into circadian and metabolic interplay in zebrafish
- Authors
- Yang, M., Liu, Y., Zhong, Z., Ou, Y., Wang, M., Zhong, Y., Liu, C.
- Source
- Full text @ Cell. Mol. Life Sci.
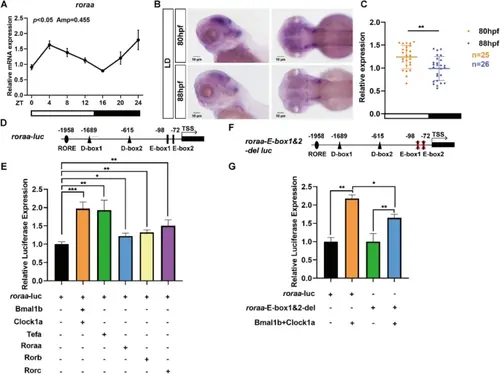
Circadian expression of the roraa gene in zebrafish is regulated by the circadian clock. A Under LD (light/dark) conditions, qRT‒PCR was used to measure the mRNA expression levels of the roraa gene in wild-type (WT) zebrafish. JTK cycle analysis revealed that roraa expression exhibited significant circadian oscillation (p < 0.05). B In situ hybridization was performed to detect roraa gene expression under LD conditions, revealing that roraa expression during the day was significantly greater than that at night, demonstrating circadian rhythmic differences. C Statistical results from in situ hybridization under LD conditions revealed that roraa expression was significantly higher during the day than at night. D Potential cis-regulatory elements on the roraa promoter fragment were predicted via the JASPAR database; two D-box elements, two E-box elements, and one RORE element, which may play key regulatory roles in the circadian expression of roraa, were identified. E Dual-luciferase reporter assays revealed that the heterodimers formed by the Bmal1b and Clocka proteins, as well as the Tefa, Roraa, Rorb, and Rorc proteins, significantly activated the expression of the roraa gene. F Diagram showing the deletion of E-box elements in the roraa-luc plasmid. G The results from dual-luciferase reporter assays demonstrated that the activation of the roraa gene by Bmal1b and Clocka was significantly reduced when E-box1 and E-box2 elements were deleted from the roraa-luc plasmid, indicating the important role of E-box elements in the regulation of roraa expression. All the data are presented as the means ± standard errors of the means (SEMs) (n = 3); ** indicates p < 0.01, **** indicates p < 0.0001 (Student's t test) |
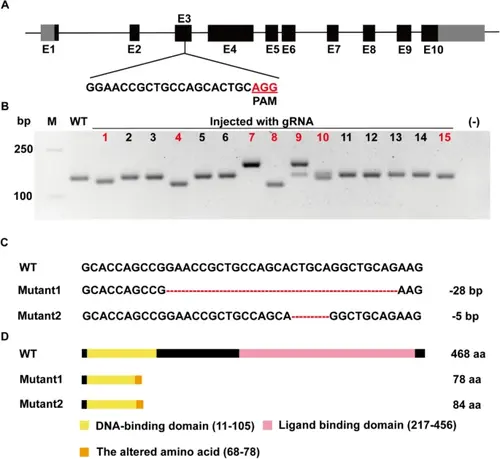
Construction of zebrafish roraa−/− mutant lines via the CRISPR/Cas9 technique. A Schematic diagram of the roraa exons and target site design. The black boxes represent exons, and the gray boxes represent UTR sequences. The gRNA was designed for the third exon, with the red area indicating the PAM site. B Evaluation of mutation efficiency in embryos after gRNA injection. Twenty-four hours postinjection, the injected embryos were compared with noninjected WT embryos for activity assessment, followed by TA cloning and random selection of colonies for PCR. The results from the 4% agarose gel electrophoresis clearly differed between the experimental group colonies and the WT group (with the corresponding colony numbers marked in red). C Comparison of DNA sequencing results between the WT and mutant strains. The mutation types in the mutants included − 28 bp and − 5 bp. D Comparison of amino acid sequences between the WT and mutant strains. The base deletion led to a frameshift mutation and an early stop codon, resulting in a truncated protein, with the mutant losing part of the DNA-binding domain and the entire ligand-binding domain |

Behavioral rhythms and gene expression changes in roraa−/− and WT zebrafish under LD conditions. A Activity curves for WT and roraa−/− plants under LD (14 h/300 lx: 10 h/30 lx) conditions. B Total activity of zebrafish, showing that compared with WT zebrafish, roraa−/− zebrafish had significantly lower activity during the day. C Average activity of zebrafish under light conditions, where roraa−/− zebrafish presented significantly lower activity during the day than did WT zebrafish. D Average activity of zebrafish under dark conditions, with no significant difference between roraa−/− and WT zebrafish. E–H Expression levels of the clock genes bmal1b, clock1a, cry1aa, and per2. The black curve represents activity changes in WT, whereas the red curve represents activity changes in roraa−/−; the method for difference analysis was Student's t test, where ns indicates p > 0.05 and *** indicates p < 0.001 |
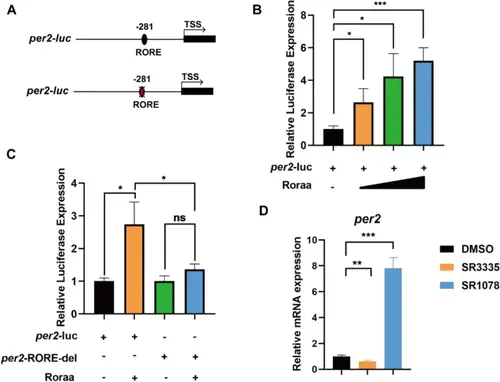
Transcriptional regulation of the clock gene per2 by Roraa in zebrafish. A Analysis of the cloned promoter sequence elements on the per2-luc plasmid, with a sequence length of 595 bp that includes one RORE element. A schematic diagram showing the deletion of the RORE in the per2 promoter sequence. B The gradient activation effect of Roraa on per2 expression, with activation increasing with increasing concentrations of Roraa at 100 ng, 200 ng, and 400 ng. C The activation effect of Roraa on per2 disappeared after the deletion of the RORE element, indicating the key role of the RORE element in Roraa's regulation of per2 expression. D Comparison of the relative expression levels of per2 in zebrafish treated with SR3335 and SR1078. “ + ” indicates cells transfected with the specific plasmid, whereas “-” indicates the control group without plasmid transfection. The method for difference analysis was Student's t test; ns indicates p > 0.05, * indicates p < 0.05, and *** indicates p < 0.001 |
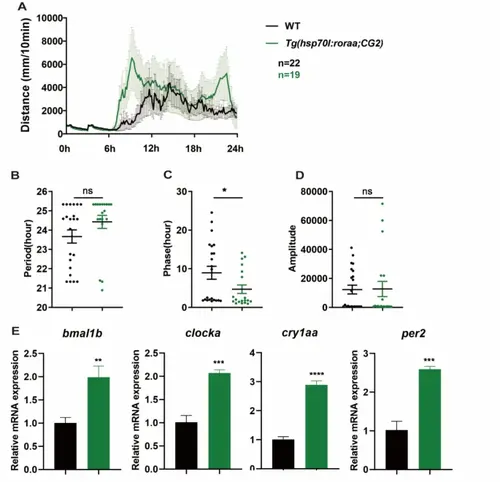
Whole-body overexpression of roraa disrupts the behavioral rhythms of zebrafish. A Activity change curves for WT and Tg(hsp70 l;CG2) after heat shock at 37 °C. B–D Analysis results of the period, phase, and amplitude. The R package MetaCycle was used for rhythmic analysis of the behavior data, and there were no significant differences in the activity period between WT and roraa−/−; however, the activity phase of roraa−/− zebrafish was advanced by approximately 5 h, and the activity amplitude was significantly lower than that of WT zebrafish. E Changes in the expression of the core clock genes bmal1b, clock1a, cry1aa, and per2 in WT and Tg(hsp70 l;CG2) after heat shock at 37 °C. The black curve represents activity changes in WT, whereas the green curve represents activity changes in Tg(hsp70 l;CG2). The method for difference analysis was Student's t test; ns indicates p > 0.05, * indicates p < 0.05 |
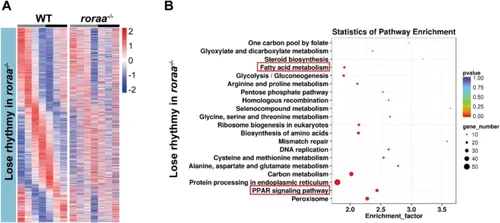
Changes in rhythmic genes and potentially affected signaling pathways after roraa gene mutation, as revealed by transcriptome sequencing. A Clustering analysis of genes whose rhythmic expression was lost in the roraa−/− mutants compared with the WT. B KEGG pathway enrichment analysis of genes whose rhythmic expression was lost in roraa−/− mutants compared with WT. The results revealed significant enrichment of fatty acid metabolism and PPAR signaling pathways |
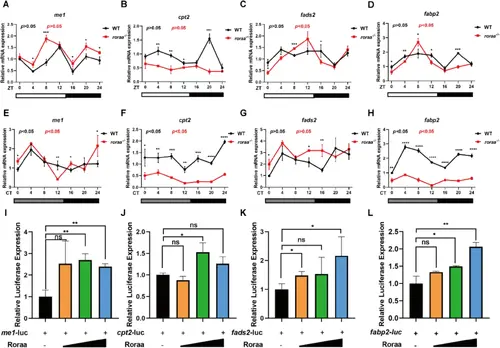
Roraa directly regulates core genes of the PPAR signaling pathway, influencing PPAR signaling activity. A–D Validation of changes in the expression of me1, cpt2, fads2, and fabp2 in WT and roraa mutants under LD conditions via real-time quantitative PCR. E–H Validation of changes in the expression of me1, cpt2, fads2, and fabp2 iin WT and roraa mutants under DD conditions via real-time quantitative PCR. The JTK cycle was used to determine whether gene expression was rhythmic, and differences in expression levels between the WT and mutant strains were analyzed at each time point. I–L Dual-luciferase reporter assays were used to detect the regulatory effects of Roraa on the activation of the me1, cpt2, fads2, and fabp2 promoters. Red represents mutants, whereas black represents WT; p values indicate results from JTK cycle rhythmicity analysis, with p < 0.05 indicating rhythmicity and p > 0.05 indicating a lack of rhythmicity. The method for difference analysis was Student's t test |
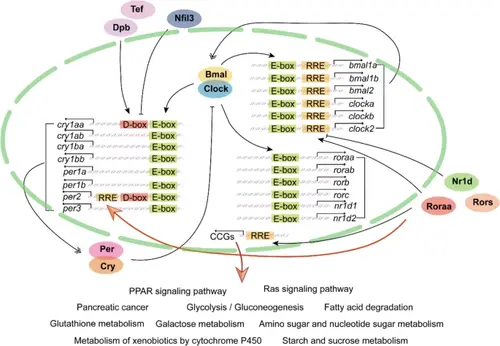
Model illustrating the regulatory role of Roraa in circadian rhythms and metabolism. This diagram depicts the interactions between the core circadian clock components (Bmal1 and Clock) and various downstream genes, including roraa, as well as their influence on metabolic pathways. Key regulatory elements, such as E-boxes, D-boxes, and ROREs, are highlighted, indicating their involvement in the transcriptional regulation of target genes. Roraa has been shown to directly influence the expression of per2 via the RORE, linking circadian control to metabolic processes. Additionally, the pathways affected by Roraa, including the PPAR signaling pathway and Ras signaling pathway, are illustrated, emphasizing its role in lipid metabolism and overall metabolic homeostasis |