
|
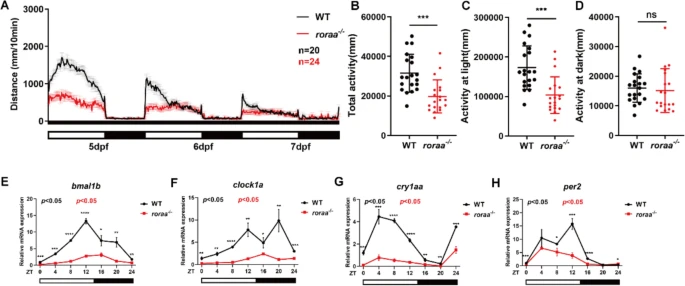
Fig. 3 Behavioral rhythms and gene expression changes in roraa−/− and WT zebrafish under LD conditions. A Activity curves for WT and roraa−/− plants under LD (14 h/300 lx: 10 h/30 lx) conditions. B Total activity of zebrafish, showing that compared with WT zebrafish, roraa−/− zebrafish had significantly lower activity during the day. C Average activity of zebrafish under light conditions, where roraa−/− zebrafish presented significantly lower activity during the day than did WT zebrafish. D Average activity of zebrafish under dark conditions, with no significant difference between roraa−/− and WT zebrafish. E–H Expression levels of the clock genes bmal1b, clock1a, cry1aa, and per2. The black curve represents activity changes in WT, whereas the red curve represents activity changes in roraa−/−; the method for difference analysis was Student's t test, where ns indicates p > 0.05 and *** indicates p < 0.001