
|
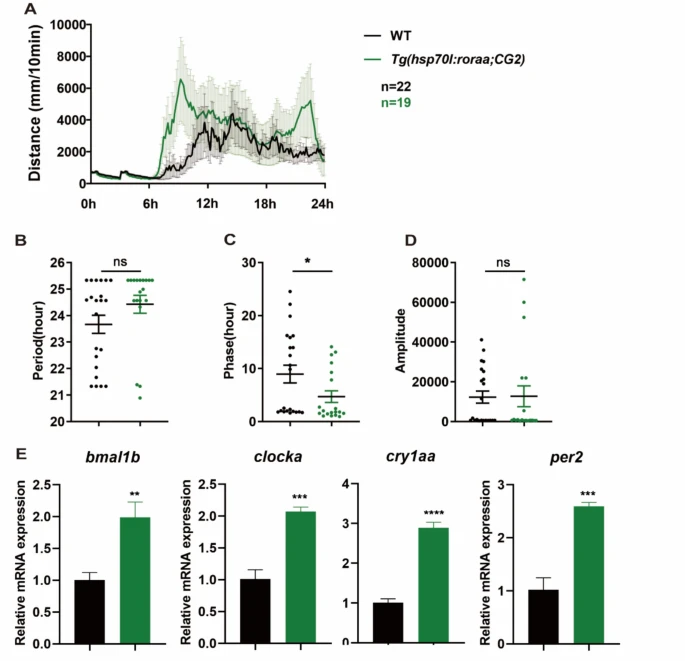
Fig. 5 Whole-body overexpression of roraa disrupts the behavioral rhythms of zebrafish. A Activity change curves for WT and Tg(hsp70 l;CG2) after heat shock at 37 °C. B–D Analysis results of the period, phase, and amplitude. The R package MetaCycle was used for rhythmic analysis of the behavior data, and there were no significant differences in the activity period between WT and roraa−/−; however, the activity phase of roraa−/− zebrafish was advanced by approximately 5 h, and the activity amplitude was significantly lower than that of WT zebrafish. E Changes in the expression of the core clock genes bmal1b, clock1a, cry1aa, and per2 in WT and Tg(hsp70 l;CG2) after heat shock at 37 °C. The black curve represents activity changes in WT, whereas the green curve represents activity changes in Tg(hsp70 l;CG2). The method for difference analysis was Student's t test; ns indicates p > 0.05, * indicates p < 0.05