
Fig. 2
- ID
- ZDB-FIG-250529-27
- Publication
- Yang et al., 2025 - Direct regulation of Per2 by Roraa: insights into circadian and metabolic interplay in zebrafish
- Other Figures
- All Figure Page
- Back to All Figure Page
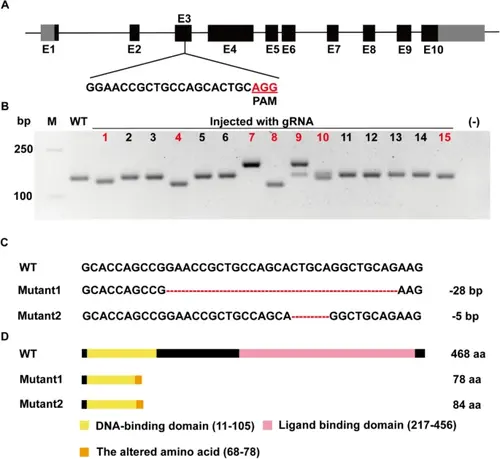
Construction of zebrafish roraa−/− mutant lines via the CRISPR/Cas9 technique. A Schematic diagram of the roraa exons and target site design. The black boxes represent exons, and the gray boxes represent UTR sequences. The gRNA was designed for the third exon, with the red area indicating the PAM site. B Evaluation of mutation efficiency in embryos after gRNA injection. Twenty-four hours postinjection, the injected embryos were compared with noninjected WT embryos for activity assessment, followed by TA cloning and random selection of colonies for PCR. The results from the 4% agarose gel electrophoresis clearly differed between the experimental group colonies and the WT group (with the corresponding colony numbers marked in red). C Comparison of DNA sequencing results between the WT and mutant strains. The mutation types in the mutants included − 28 bp and − 5 bp. D Comparison of amino acid sequences between the WT and mutant strains. The base deletion led to a frameshift mutation and an early stop codon, resulting in a truncated protein, with the mutant losing part of the DNA-binding domain and the entire ligand-binding domain |