
Image
|
Figure Caption
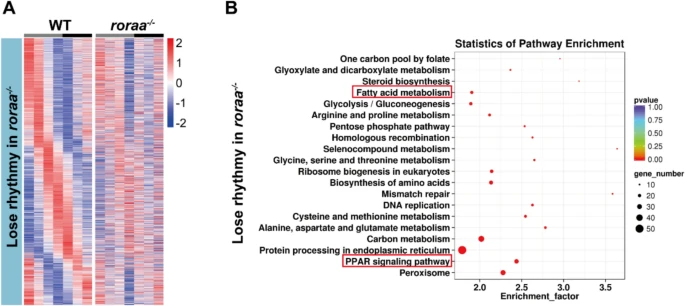
Fig. 6 Changes in rhythmic genes and potentially affected signaling pathways after roraa gene mutation, as revealed by transcriptome sequencing. A Clustering analysis of genes whose rhythmic expression was lost in the roraa−/− mutants compared with the WT. B KEGG pathway enrichment analysis of genes whose rhythmic expression was lost in roraa−/− mutants compared with WT. The results revealed significant enrichment of fatty acid metabolism and PPAR signaling pathways
Acknowledgments
This image is the copyrighted work of the attributed author or publisher, and
ZFIN has permission only to display this image to its users.
Additional permissions should be obtained from the applicable author or publisher of the image.
Full text @ Cell. Mol. Life Sci.