
- Title
-
DNA damage response deficiency enhances neuroblastoma progression and sensitivity to combination PARP and ATR inhibition
- Authors
- Hayes, M.N., Cohen-Gogo, S., Kee, L., Xiong, X., Weiss, A., Layeghifard, M., Ladumor, Y., Valencia-Sama, I., Rajaselvam, A., Kaplan, D.R., Villani, A., Shlien, A., Morgenstern, D.A., Irwin, M.S.
- Source
- Full text @ Cell Rep.
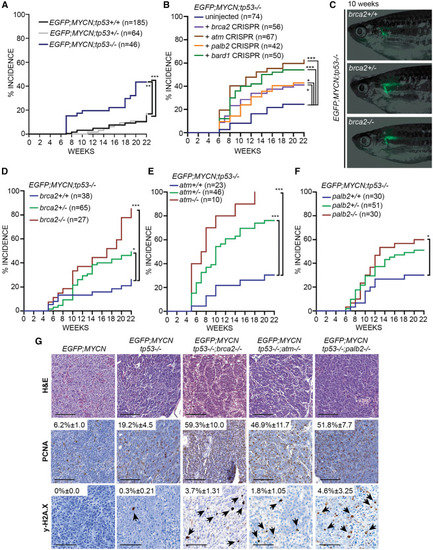
DDR deficiency enhances MYCN-induced NB formation in vivo (A) EGFP+ NB incidence up to 22 weeks post fertilization (wpf) in EGFP;MYCN;tp53+/+, EGFP;MYCN;tp53+/−, and EGFP;MYCN;tp53−/− zebrafish. Tp53 loss leads to a significant increase in NB, compared to tp53 heterozygous (n = 64, ∗∗p = 0.0019, log-rank test) and wild-type (n = 185, ∗∗∗p < 0.0001, log-rank test) animals. (B) EGFP+ NB incidence in uninjected EGFP;MYCN;tp53−/− zebrafish and EGFP;MYCN;tp53−/− zebrafish injected with sgRNAs/Cas9 targeting brca2, atm, palb2, and bard1 (Table S2). Increases were detected for mosaic-injected brca2 (p = 0.0235, n = 56), atm (p < 0.0001, n = 67), palb2 (p = 0.0271, n = 42), and bard1 (p = 0.0002, n = 50) compared to EGFP;MYCN;tp53−/−. ∗p < 0.05, ∗∗∗p < 0.001, log-rank test. (C) EGFP expression in primary NB at the inter-renal gland of 10-wpf EGFP;MYCN;tp53−/−;brca2+/+, EGFP;MYCN;tp53−/−;brca2+/−, and EGFP;MYCN;tp53−/−;brca2−/− zebrafish. (D–F) NB incidence among EGFP;MYCN;tp53−/− cohorts carrying wild-type and mutant alleles of brca2 (D), atm (E), and palb2 (F). Differences between curves are compared to EGFP;MYCN;tp53−/− siblings. ∗p < 0.05, ∗∗∗p < 0.001, log-rank test. (G) Hematoxylin and eosin (H&E) staining and immunohistochemical staining of PCNA and y-H2AX of tumor sections. Quantification of positive nuclei relative to total nuclei is indicated and compared to EGFP;MYCN (PCNA: brca2−/− p = 0.0032, atm−/− p = 0.018, palb2−/− p = 0.0032, n = 3; y-H2AX: brca2−/− p = 0.0081, atm−/− p = 0.0412, palb2−/− p = 0.0703, n = 3). Values indicate mean ± standard deviation. Black arrowheads indicate y-H2AX-positive cells. Scale bars, 50 μm. |
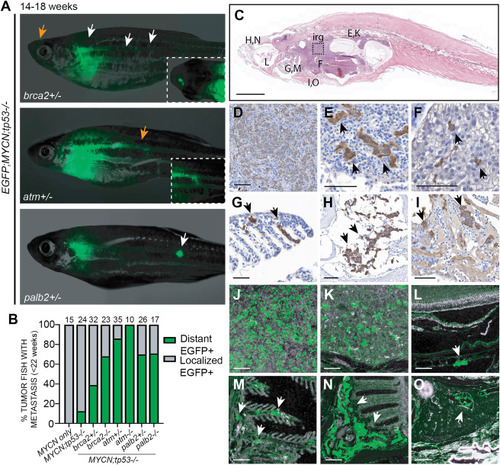
DDR deficiency promotes NB metastasis in vivo (A) EGFP;MYCN;tp53−/−;brca2+/−, EGFP;MYCN;tp53−/−;atm+/−, and EGFP;MYCN;tp53−/−;palb2+/− zebrafish at 14–18 wpf displaying disseminated EGFP+ tumor cells (arrows). Insets highlight regions indicated by orange arrows. (B) Proportion of tumor-bearing zebrafish displaying metastases prior to 22 weeks of age. The percentage of DDR-deficient animals with disseminated NB is increased compared to EGFP;MYCN;tp53−/− (brca2+/− p = 0.031, brca2−/− p < 0.0001, atm+/− p < 0.0001, atm−/− p < 0.0001, palb2+/− p = 0.0154, plab2−/− p = 0.0235, Fisher’s exact test). (C) H&E-stained sagittal section of EGFP;MYCN;tp53−/−;brca2−/− zebrafish at 20 weeks of age. (D–I) Immunohistological stains of sagittal sections of EGFP;MYCN;tp53−/−;brca2−/− using tyrosine hydroxylase (TH). (J–O) Immunofluorescence stains of EGFP;MYCN;tp53−/−;brca2−/− using anti-GFP. The inter-renal gland (irg) is magnified in (D) and (J). Renal tubules are magnified in (E) and (K). Disseminated tumor cells were also detected in DDR-deficient models in the liver (F, arrow), the orbit (L, arrow), the gills (G and M, arrows), olfactory pits (H and N, arrows), and within the heart chambers (I and O, arrows). Scale bars, 100 μm. |
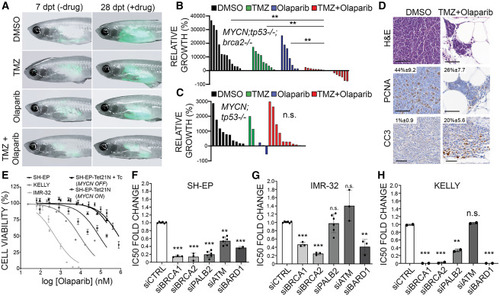
DDR deficiency enhances NB sensitivities to olaparib PARP inhibitor with and without temozolomide chemotherapy (A) casper−/−;prkdc−/− animals engrafted with EGFP;MYCN;tp53−/−;brca2−/− NB cells at 7 days post transplant (dpt) prior to oral drug administrations and at 28 dpt after DMSO vehicle control, temozolomide (TMZ), olaparib, or olaparib + TMZ treatments. (B and C) Quantification of relative growth after treatments for EGFP;MYCN;tp53−/−;brca2−/− NB (B, n = 3 independent primary tumors) and EGFP;MYCN;tp53−/− NB (C, n = 2 independent primary tumors). ∗∗p < 0.01; n.s., not significant; Student’s t test. (D) H&E, PCNA, and cleaved caspase-3 (CC3) staining on EGFP;MYCN;tp53−/−;brca2−/− NB sections following control and olaparib + TMZ treatment. Average percent positive cells are indicated. Significant CC3 increases were observed in olaparib + TMZ-treated EGFP;MYCN;tp53−/−;brca2−/− NB compared to DMSO control (p = 0.0044, n = 3). (E) Cell-viability analysis in NB cell lines following treatment with olaparib (0.05–800 μM) for 72 h. Error bars represent mean ± standard deviation. (F–H) Fold changes in half-maximal inhibitory concentration (IC50) of olaparib normalized to control (siCTRL) in NB cells with DDR gene knockdown. Error bars denote mean ± standard deviation. ∗∗p < 0.01, ∗∗∗p < 0.001; n.s., not significant. |
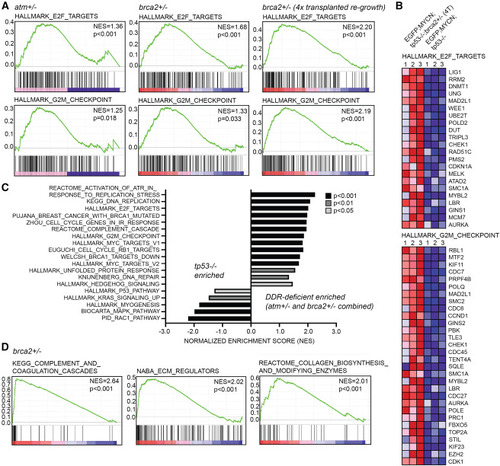
DDR-deficient zebrafish NB tumors display upregulation of DNA repair and cell-cycle checkpoint gene-expression signatures (A) Gene set enrichment analysis (GSEA) following RNA sequencing of primary EGFP;MYCN;tp53−/−;atm+/−, primary EGFP;MYCN;tp53−/−;brca2+/−, and four-time (4×) serially transplanted EGFP;MYCN;tp53−/−;brca2+/− NB compared to EGFP;MYCN;tp53−/−. GSEA indicates enrichment for E2F and G2M checkpoint gene-expression signatures. Normalized enrichment scores (NES) and nominal p values are indicated. (B) Heatmaps for top enriched E2F and G2M checkpoint genes in transplanted EGFP;MYCN;tp53−/−;brca2+/− NB compared to EGFP;MYCN;tp53−/−. (C) Selected gene signatures enriched in primary NBs. DDR-deficient NB represents brca2+/− and atm+/− combined (n = 5 tumors). Bar color indicates significance. (D) GSEA analysis of primary EGFP;MYCN;tp53−/−;brca2+/− NB compared to EGFP;MYCN;tp53−/− indicates enrichment for gene expression associated with tumor cell invasion and metastasis. |
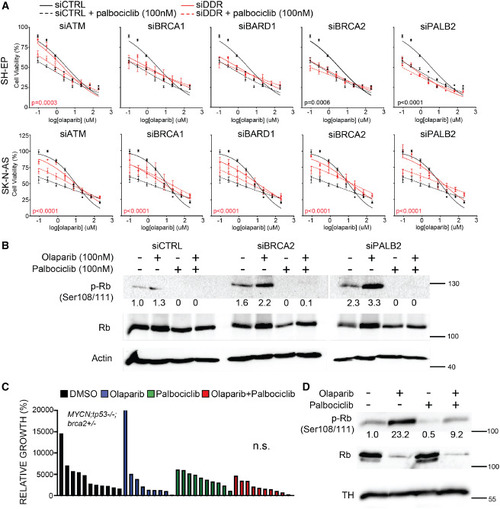
CDK4/6 inhibitor palbociclib does not synergize with olaparib in DDR-deficient NB cells (A) Cell-viability analysis in human NB cells following siRNA-mediated gene knockdown of DDR genes and 72-h treatment with olaparib (0.05–800 μM) + palbociclib (100 nM). Error bars represent mean ± standard deviation. p values represent comparisons of non-linear fits between siDDR and control (siCTRL) cells treated with olaparib + palbociclib. Black p values indicate increased sensitivity (decreased IC50) with siDDR. Red p values highlight resistance (increased IC50) with siDDR. Comparisons of best-fit values for all treatment groups are shown in Table S8. (B) Western blot analysis of phosphorylated Rb (p-Rb Ser108/111) and total Rb protein in SH-EP cells in response to olaparib and/or palbociclib treatments following control (siCTRL), BRCA2 (siBRCA2), and PALB2 (siPALB2) knockdown. Actin is used as loading control. p-Rb is quantified below each lane normalized to total Rb protein and untreated control (siCTRL). (C) Quantification of relative growth after DMSO vehicle control, olaparib (50 mg/kg), palbociclib (100 mg/kg), or olaparib + palbociclib dosing to zebrafish engrafted with EGFP;MYCN;tp53−/−;brca2+/− NB (n = 2 independent primary tumors). Differences between control and combination treatment groups is not significant (n.s.), Student’s t test. (D) Western blot analysis of phosphorylated Rb (p-Rb Ser108/111) and total Rb protein in response to treatment. Tyrosine hydroxylase (TH) is used as a loading control for total tumor cells. p-Rb is quantified below each lane and normalized to total Rb protein and vehicle control-treated sample. Replicate western blots are shown in Figure S8. |
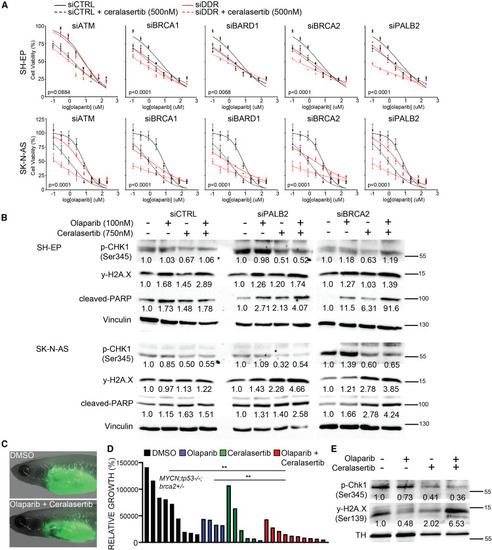
The ATR inhibitor ceralasertib enhances olaparib-mediated inhibition of DDR-deficient NB cells (A) Cell-viability analysis in human NB cell lines following siRNA-mediated gene knockdown of DDR genes and treatment with olaparib (0.05–800 μM) + ceralasertib (500 nM). Error bars represent mean ± standard deviation. p values represent comparisons of non-linear fits between siDDR and siControl (siCTRL) cells treated with olaparib + ceralasertib. Comparisons of best-fit values for all treatment groups are shown in Table S8. (B) Western blot analysis of phosphorylated CHK1 (p-CHK1, Ser345), phosphorylated H2A.X (Ser345, y-H2AX), and cleaved PARP in cells following control (siCTRL), PALB2 (siPALB2), and BRCA2 (siBRCA2) knockdown. Vinculin is used as loading control. Relative protein levels are quantified below each lane and normalized to vinculin followed by vehicle control drug-treated cells within each siRNA treatment. (C) casper;prkdc−/− zebrafish engrafted with EGFP;MYCN;tp53−/−;brca2+/− NB following DMSO vehicle control and olaparib (50 mg/kg, 4 consecutive days/week) + ceralasertib (40 mg/kg, 4 consecutive days/week) treatments. (D) Quantification of relative growth of DMSO vehicle control, olaparib (50 mg/kg), palbociclib (40 mg/kg), and combination olaparib + ceralasertib treated EGFP;MYCN;tp53−/−;brca2+/− NB. Combined results from two independent primary tumors, minimum two technical replicates for each treatment cohort. Differences between control and combination treatment group is significant (p = 0.0037), Student’s t test. (E) Western blot of p-Chk1 (Ser345) and y-H2AX (Ser139) in response to in vivo control and drug treatments. Tyrosine hydroxylase (TH) is used as a loading control for tumor cells. Relative p-Chk1 and y-H2AX levels are quantified below each lane and displayed normalized to TH protein and vehicle control-treated samples. Replicate western blots are shown in Figure S9. |