|
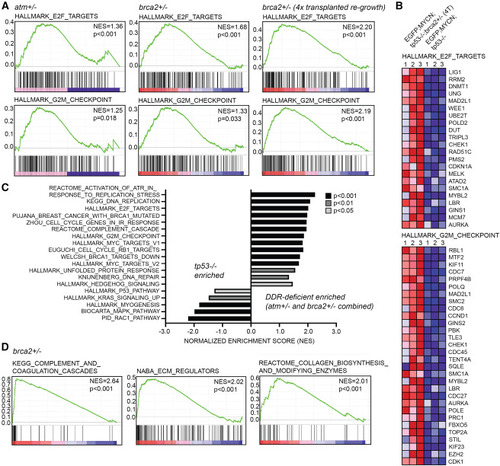
DDR-deficient zebrafish NB tumors display upregulation of DNA repair and cell-cycle checkpoint gene-expression signatures (A) Gene set enrichment analysis (GSEA) following RNA sequencing of primary EGFP;MYCN;tp53−/−;atm+/−, primary EGFP;MYCN;tp53−/−;brca2+/−, and four-time (4×) serially transplanted EGFP;MYCN;tp53−/−;brca2+/− NB compared to EGFP;MYCN;tp53−/−. GSEA indicates enrichment for E2F and G2M checkpoint gene-expression signatures. Normalized enrichment scores (NES) and nominal p values are indicated. (B) Heatmaps for top enriched E2F and G2M checkpoint genes in transplanted EGFP;MYCN;tp53−/−;brca2+/− NB compared to EGFP;MYCN;tp53−/−. (C) Selected gene signatures enriched in primary NBs. DDR-deficient NB represents brca2+/− and atm+/− combined (n = 5 tumors). Bar color indicates significance. (D) GSEA analysis of primary EGFP;MYCN;tp53−/−;brca2+/− NB compared to EGFP;MYCN;tp53−/− indicates enrichment for gene expression associated with tumor cell invasion and metastasis.
|