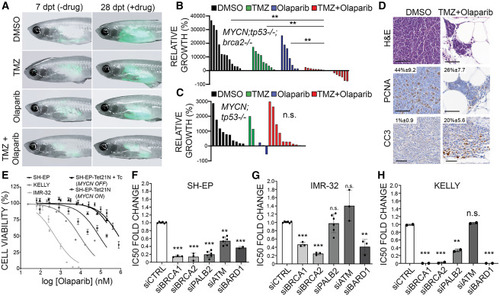
DDR deficiency enhances NB sensitivities to olaparib PARP inhibitor with and without temozolomide chemotherapy (A) casper−/−;prkdc−/− animals engrafted with EGFP;MYCN;tp53−/−;brca2−/− NB cells at 7 days post transplant (dpt) prior to oral drug administrations and at 28 dpt after DMSO vehicle control, temozolomide (TMZ), olaparib, or olaparib + TMZ treatments. (B and C) Quantification of relative growth after treatments for EGFP;MYCN;tp53−/−;brca2−/− NB (B, n = 3 independent primary tumors) and EGFP;MYCN;tp53−/− NB (C, n = 2 independent primary tumors). ∗∗p < 0.01; n.s., not significant; Student’s t test. (D) H&E, PCNA, and cleaved caspase-3 (CC3) staining on EGFP;MYCN;tp53−/−;brca2−/− NB sections following control and olaparib + TMZ treatment. Average percent positive cells are indicated. Significant CC3 increases were observed in olaparib + TMZ-treated EGFP;MYCN;tp53−/−;brca2−/− NB compared to DMSO control (p = 0.0044, n = 3). (E) Cell-viability analysis in NB cell lines following treatment with olaparib (0.05–800 μM) for 72 h. Error bars represent mean ± standard deviation. (F–H) Fold changes in half-maximal inhibitory concentration (IC50) of olaparib normalized to control (siCTRL) in NB cells with DDR gene knockdown. Error bars denote mean ± standard deviation. ∗∗p < 0.01, ∗∗∗p < 0.001; n.s., not significant.
|
