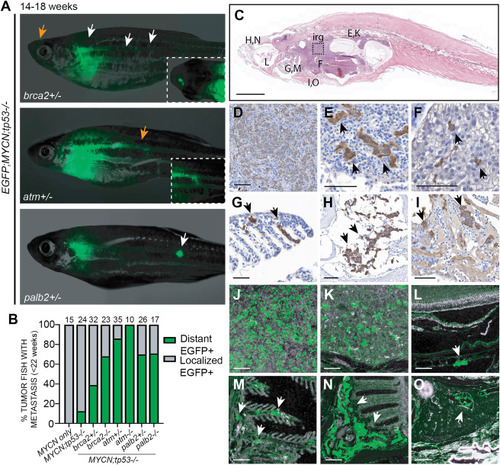
DDR deficiency promotes NB metastasis in vivo (A) EGFP;MYCN;tp53−/−;brca2+/−, EGFP;MYCN;tp53−/−;atm+/−, and EGFP;MYCN;tp53−/−;palb2+/− zebrafish at 14–18 wpf displaying disseminated EGFP+ tumor cells (arrows). Insets highlight regions indicated by orange arrows. (B) Proportion of tumor-bearing zebrafish displaying metastases prior to 22 weeks of age. The percentage of DDR-deficient animals with disseminated NB is increased compared to EGFP;MYCN;tp53−/− (brca2+/− p = 0.031, brca2−/− p < 0.0001, atm+/− p < 0.0001, atm−/− p < 0.0001, palb2+/− p = 0.0154, plab2−/− p = 0.0235, Fisher’s exact test). (C) H&E-stained sagittal section of EGFP;MYCN;tp53−/−;brca2−/− zebrafish at 20 weeks of age. (D–I) Immunohistological stains of sagittal sections of EGFP;MYCN;tp53−/−;brca2−/− using tyrosine hydroxylase (TH). (J–O) Immunofluorescence stains of EGFP;MYCN;tp53−/−;brca2−/− using anti-GFP. The inter-renal gland (irg) is magnified in (D) and (J). Renal tubules are magnified in (E) and (K). Disseminated tumor cells were also detected in DDR-deficient models in the liver (F, arrow), the orbit (L, arrow), the gills (G and M, arrows), olfactory pits (H and N, arrows), and within the heart chambers (I and O, arrows). Scale bars, 100 μm.
|
