
|
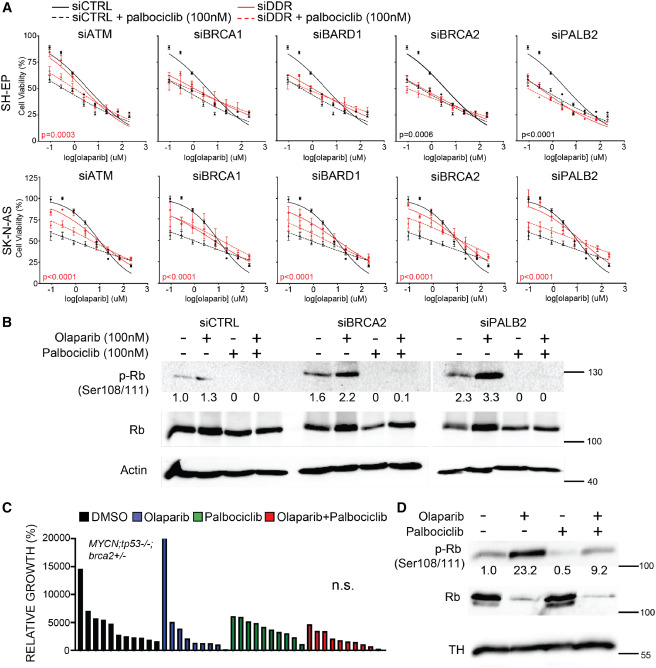
Fig. 5 CDK4/6 inhibitor palbociclib does not synergize with olaparib in DDR-deficient NB cells (A) Cell-viability analysis in human NB cells following siRNA-mediated gene knockdown of DDR genes and 72-h treatment with olaparib (0.05–800 μM) + palbociclib (100 nM). Error bars represent mean ± standard deviation. p values represent comparisons of non-linear fits between siDDR and control (siCTRL) cells treated with olaparib + palbociclib. Black p values indicate increased sensitivity (decreased IC50) with siDDR. Red p values highlight resistance (increased IC50) with siDDR. Comparisons of best-fit values for all treatment groups are shown in Table S8. (B) Western blot analysis of phosphorylated Rb (p-Rb Ser108/111) and total Rb protein in SH-EP cells in response to olaparib and/or palbociclib treatments following control (siCTRL), BRCA2 (siBRCA2), and PALB2 (siPALB2) knockdown. Actin is used as loading control. p-Rb is quantified below each lane normalized to total Rb protein and untreated control (siCTRL). (C) Quantification of relative growth after DMSO vehicle control, olaparib (50 mg/kg), palbociclib (100 mg/kg), or olaparib + palbociclib dosing to zebrafish engrafted with EGFP;MYCN;tp53−/−;brca2+/− NB (n = 2 independent primary tumors). Differences between control and combination treatment groups is not significant (n.s.), Student’s t test. (D) Western blot analysis of phosphorylated Rb (p-Rb Ser108/111) and total Rb protein in response to treatment. Tyrosine hydroxylase (TH) is used as a loading control for total tumor cells. p-Rb is quantified below each lane and normalized to total Rb protein and vehicle control-treated sample. Replicate western blots are shown in Figure S8.