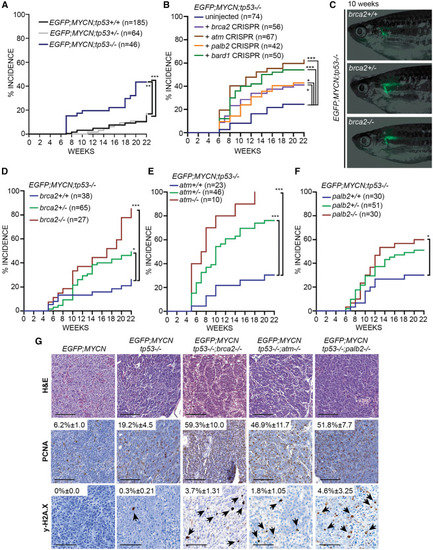
DDR deficiency enhances MYCN-induced NB formation in vivo (A) EGFP+ NB incidence up to 22 weeks post fertilization (wpf) in EGFP;MYCN;tp53+/+, EGFP;MYCN;tp53+/−, and EGFP;MYCN;tp53−/− zebrafish. Tp53 loss leads to a significant increase in NB, compared to tp53 heterozygous (n = 64, ∗∗p = 0.0019, log-rank test) and wild-type (n = 185, ∗∗∗p < 0.0001, log-rank test) animals. (B) EGFP+ NB incidence in uninjected EGFP;MYCN;tp53−/− zebrafish and EGFP;MYCN;tp53−/− zebrafish injected with sgRNAs/Cas9 targeting brca2, atm, palb2, and bard1 (Table S2). Increases were detected for mosaic-injected brca2 (p = 0.0235, n = 56), atm (p < 0.0001, n = 67), palb2 (p = 0.0271, n = 42), and bard1 (p = 0.0002, n = 50) compared to EGFP;MYCN;tp53−/−. ∗p < 0.05, ∗∗∗p < 0.001, log-rank test. (C) EGFP expression in primary NB at the inter-renal gland of 10-wpf EGFP;MYCN;tp53−/−;brca2+/+, EGFP;MYCN;tp53−/−;brca2+/−, and EGFP;MYCN;tp53−/−;brca2−/− zebrafish. (D–F) NB incidence among EGFP;MYCN;tp53−/− cohorts carrying wild-type and mutant alleles of brca2 (D), atm (E), and palb2 (F). Differences between curves are compared to EGFP;MYCN;tp53−/− siblings. ∗p < 0.05, ∗∗∗p < 0.001, log-rank test. (G) Hematoxylin and eosin (H&E) staining and immunohistochemical staining of PCNA and y-H2AX of tumor sections. Quantification of positive nuclei relative to total nuclei is indicated and compared to EGFP;MYCN (PCNA: brca2−/− p = 0.0032, atm−/− p = 0.018, palb2−/− p = 0.0032, n = 3; y-H2AX: brca2−/− p = 0.0081, atm−/− p = 0.0412, palb2−/− p = 0.0703, n = 3). Values indicate mean ± standard deviation. Black arrowheads indicate y-H2AX-positive cells. Scale bars, 50 μm.
|
