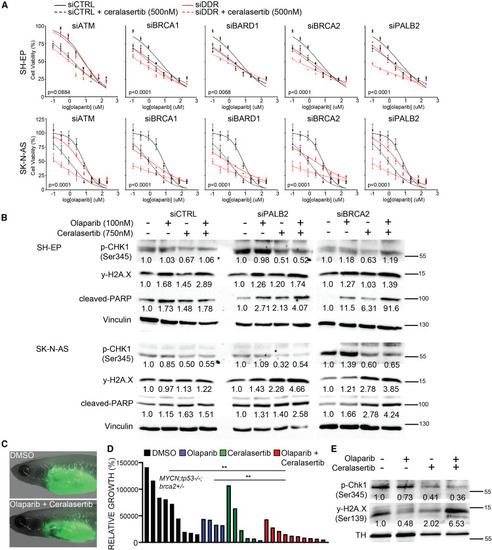
The ATR inhibitor ceralasertib enhances olaparib-mediated inhibition of DDR-deficient NB cells (A) Cell-viability analysis in human NB cell lines following siRNA-mediated gene knockdown of DDR genes and treatment with olaparib (0.05–800 μM) + ceralasertib (500 nM). Error bars represent mean ± standard deviation. p values represent comparisons of non-linear fits between siDDR and siControl (siCTRL) cells treated with olaparib + ceralasertib. Comparisons of best-fit values for all treatment groups are shown in Table S8. (B) Western blot analysis of phosphorylated CHK1 (p-CHK1, Ser345), phosphorylated H2A.X (Ser345, y-H2AX), and cleaved PARP in cells following control (siCTRL), PALB2 (siPALB2), and BRCA2 (siBRCA2) knockdown. Vinculin is used as loading control. Relative protein levels are quantified below each lane and normalized to vinculin followed by vehicle control drug-treated cells within each siRNA treatment. (C) casper;prkdc−/− zebrafish engrafted with EGFP;MYCN;tp53−/−;brca2+/− NB following DMSO vehicle control and olaparib (50 mg/kg, 4 consecutive days/week) + ceralasertib (40 mg/kg, 4 consecutive days/week) treatments. (D) Quantification of relative growth of DMSO vehicle control, olaparib (50 mg/kg), palbociclib (40 mg/kg), and combination olaparib + ceralasertib treated EGFP;MYCN;tp53−/−;brca2+/− NB. Combined results from two independent primary tumors, minimum two technical replicates for each treatment cohort. Differences between control and combination treatment group is significant (p = 0.0037), Student’s t test. (E) Western blot of p-Chk1 (Ser345) and y-H2AX (Ser139) in response to in vivo control and drug treatments. Tyrosine hydroxylase (TH) is used as a loading control for tumor cells. Relative p-Chk1 and y-H2AX levels are quantified below each lane and displayed normalized to TH protein and vehicle control-treated samples. Replicate western blots are shown in Figure S9.
|
