
- Title
-
Identification and functional validation of a novel FBN1 variant in a Marfan syndrome family using a zebrafish model
- Authors
- Huang, S., Chen, J., Wang, Q., Zhang, R., Zhuang, J., Huang, R., Yu, C., Fang, M., Zhao, H., Lei, L.
- Source
- Full text @ BMC Genomics

Marfanoid symptoms of the patient. (A) Clinical manifestations of the spine, hands, and feet. (B) CT three-dimensional (3D) reconstructions of the spine and aorta. These reconstructions revealed “scoliosis” and “Stanford type A aortic dissection, aortic coarctation, and aberrant right subclavian artery”. The red circle indicated the right subclavian artery of ectopic origin. (C) Family pedigree. The red arrow indicates the proband. Blank filling indicates not affected, black filling indicates affected and genetically confirmed, and green filling indicates affected but not genetically tested. A line through the shape indicates the dead member |

WES identified a novel FBN1 mutation [NM_000138.5; c.7764 C > G: p.(Y2588*)] and thestructural reconstruction. (A). BAM illustration of WES in the proband’s family of four. The gray area indicated the second-generation capture coverage. At position c.7764, the C/G ratio is as follows: C: 103 (forward: 35 +, reverse: 68 -), comprising 47% of the total; G: 116 (forward: 42 +, reverse: 74 -), comprising 53% of the total. (B). The Sanger sequence of other 4 family members showed no mutation in c.7764. (C). Protein prediction models of WT FBN1 and p.Y2588* mutated FBN1. The p.Y2588* mutation leads to the substitution of the 2588th amino acid of the wild-type FBN1 protein with a premature stop codon, resulting in an FBN1 protein with only 2588 amino acids, thereby lacking 283 amino acids. (D). Structural models for the wild-type and mutant FBN1 proteins in 2487aa-2686aa region. The p.Y2588* variant also led to a more loosely arranged and structurally abnormal conformation in the 2487aa-2588aa region of the protein, prior to the premature termination |
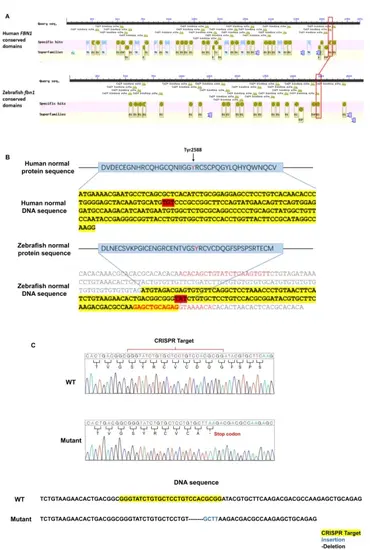
Structure analyses of the nonsense mutation in the calcium binding (cb) epidermal growth factor (EGF)-like31 domain. (A-B) Generation of fbn1+/− zebrafish. The conserved domains of FBN1 protein in zebrafish are shown. The red box indicates the locus of the nonsense mutation, and the red highlight indicates the target of CRISPR/Cas9 gene editing. WT: wildtype. (C) Sequencing chromatograms of wild type and the mutant allele. The CRISPR/Cas9 induced the mutation containing a terminator insertion in fbn1 |

Phenotypic Spectrum of F2 fbn1+/− Zebrafish larvae. F2 fbn1+/− Zebrafish were phenotyped with light microscopy in the zebrafish representative images are shown. Number of animals = 743, N = 3. Data were compared using an independent two-sample t-test, and the P-values were calculated to assess the significance of the difference in means between the two groups. Values of *P ≤ 0.05 were considered significant. (A) Comparison of the morphology between F2 fbn1+/− and WT zebrafish larvae at 72 hpf in the brightfield. WT zebrafish shows minimal pericardial effusion and no tail defects; A moderately affected morphant with a small amount of pericardial effusion, protruding mouth, and a curly tail; A severely affected morphant with a large pericardial effusion, protruding mouth, and severe tail curvature. The white arrow in the figure refers to the aortic arches bleeding (B) Comparison of the heart between F2 fbn1+/− and WT zebrafish larvae at 72 hpf. (C) Comparison of the cardiac function between F2 fbn1+/− and WT zebrafish larvae at 72 hpf. F2 fbn1+/− zebrafish appear significant defects in ejection fraction and fraction shorting. (D) F2 fbn1+/− Zebrafish larvae show angiogenesis abnormalities phenotype. WT zebrafish phenotype (120 hpf). F2 fbn1+/− Zebrafish shows the blood vessels are not cavitated. Some F2 fbn1+/− Zebrafish shows the increased dorsal aorta diameter phenotype and intersegmental vascular disorders. (E) Incidence of angiogenesis abnormalities in F2 fbn1+/− Zebrafish larvae at 120 hpf. hpf: hours post-fertilization; FS: fraction shorting; EF: ejection fraction. (F). Photomicrographs of 144 and 168 hpf zebrafish larvae at the ventral view. All cartilage and bones appear normally shaped and developed in WT zebrafish. F2 fbn1+/− zebrafish exhibits bigger Meckel’s cartilage and the increased distance from Meckel’s cartilage to the ceratohyal increased. (G). The ratio of the distance from Meckel’s cartilage to ceratohyal and the length of head in F2 fbn1+/− and WT zebrafish. N: number of independent experiments; WT: wild type; hpf: hour post fertilization; ns: no sense; **: p < 0.01; ***: p < 0.001 |
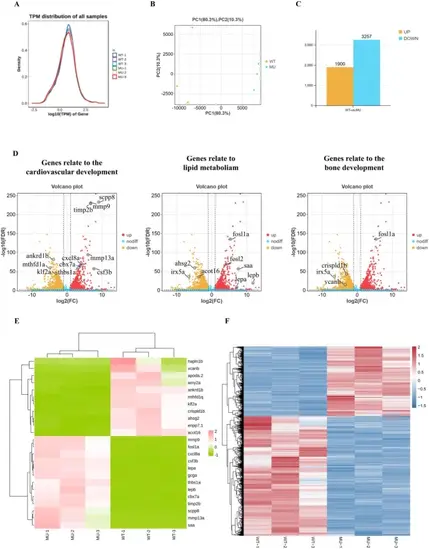
Whole transcriptome RNA-seq profile of larval zebrafish. (A) Gene expression abundance distribution plot. Tthe horizontal axis depicts the log10-transformed transcripts per million (tpm), signifying higher expression levels at greater values. The vertical axis represents gene abundance, defined as the proportion of genes at a given expression level relative to the total number of detected expressed genes. Each color in the plot corresponds to a distinct sample, with the distribution curve’s peak highlighting the most concentrated region of gene expression across the samples. (B) Principal Component Analysis. The coordinates along the first principal component (PC1) are shown, accompanied by the percentage in parentheses that denotes PC1’s contribution to sample variability. Similarly, the second principal component (PC2) is represented, with its contribution to sample differences indicated. The plot’s colored dots correspond to individual samples, visually demonstrating their relationships in the multivariate space. (C) Differential gene expression plot. Horizontal axis: Paired comparison samples; Vertical axis: Number of differentially expressed genes. (D) Differential gene expression volcano plot. In the volcano plot, significant genes involved in cardiovascular development, ossification, and fluid metabolism are specifically marked, indicating their role in the biological processes of interest. (E). Heatmap of expression of these significant differential genes that are marked in the volcano plot. (F). Heatmap of expression of differential genes in the WT and F2 fbn1+/− zebrafish. The heatmap summarizing the expression profiles of all differentially expressed genes between the wild-type and F2 heterozygous fbn1+/− zebrafish, providing an overview of the genetic differences that may underlie phenotypic variations |
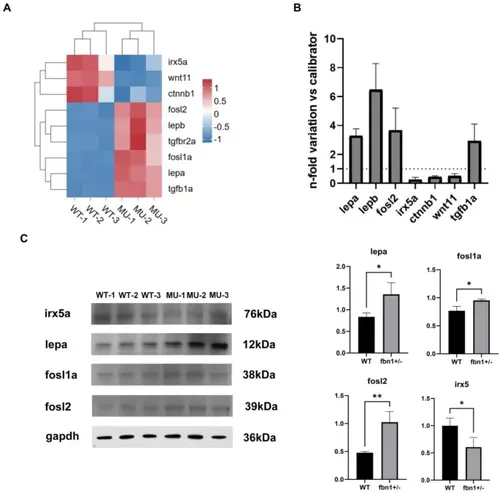
(A). Heatmap of expression of these significant differential genes that related to bone development and lipid metabolism. (B) qRT-PCR. The bar graph shows expression of lepa, lepb, fosl2, irx5a, ctnnb1, wnt11, and tgfb1a mRNA in fbn1+/− zebrafish. The results were obtained using 10 zebrafish per each experimental group and are expressed as mean ± SEM. Data were compared using an independent two-sample t-test, and the P-values were calculated to assess the significance of the difference in means between the two groups. Values of *P ≤ 0.05 were considered significant. (C). Western blotting analysis. Proteins related to lipid metabolism were detected by western blotting for their presence and quantity. *: p < 0.05; **: p < 0.01; ***: p < 0.001. Full-length blots/gels are presented in Supplementary Fig. 1 |
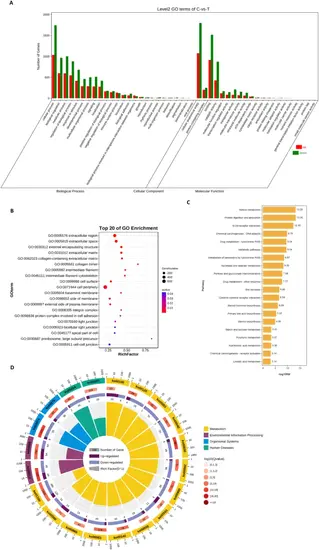
Differential gene expression analysis. (A) The bar chart of GO enrichment analysis. The x-axis represents the second-level GO terms, the y-axis represents the number of differentially expressed genes in that term, with red indicating upregulation and green indicating downregulation. (B) bubble diagram of the top 15 noticeably enriched pathways. The graph is plotted with p-values of significance for various pathways. The abscissa denotes the gene-rich factor (i.e., the number of differential genes enriched to the current pathway/the number of that species enriched to the current pathway), and the ordinate represents the pathway. Bubble size represents the number of genes enriched in different pathways, and bubble color represents the degree of enrichment in different pathways. (C) statistical plot of the grade B classification of each pathway of the differentially enriched genes. (D) circle-marker plots of the top 15 significantly enriched differential pathways. Outside the circle is a sitting ruler of the gene number. Different colors represent different KEGG A Class |