|
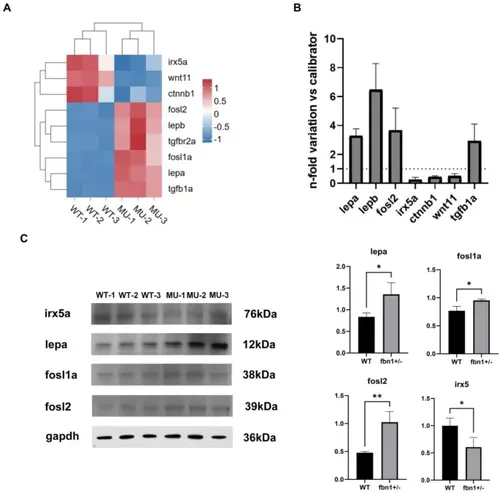
(A). Heatmap of expression of these significant differential genes that related to bone development and lipid metabolism. (B) qRT-PCR. The bar graph shows expression of lepa, lepb, fosl2, irx5a, ctnnb1, wnt11, and tgfb1a mRNA in fbn1+/− zebrafish. The results were obtained using 10 zebrafish per each experimental group and are expressed as mean ± SEM. Data were compared using an independent two-sample t-test, and the P-values were calculated to assess the significance of the difference in means between the two groups. Values of *P ≤ 0.05 were considered significant. (C). Western blotting analysis. Proteins related to lipid metabolism were detected by western blotting for their presence and quantity. *: p < 0.05; **: p < 0.01; ***: p < 0.001. Full-length blots/gels are presented in Supplementary Fig. 1
|