
- Title
-
Pannexin-2 deficiency disrupts visual pathways and leads to ocular defects in zebrafish
- Authors
- Shanbhag, R., Zoidl, G.S.O., Nakhuda, F., Sabour, S., Nauman, H., Zoidl, C., Bahl, A., Tabatabaei, N., Zoidl, G.R.
- Source
- Full text @ BBA Molecular Basis of Disease
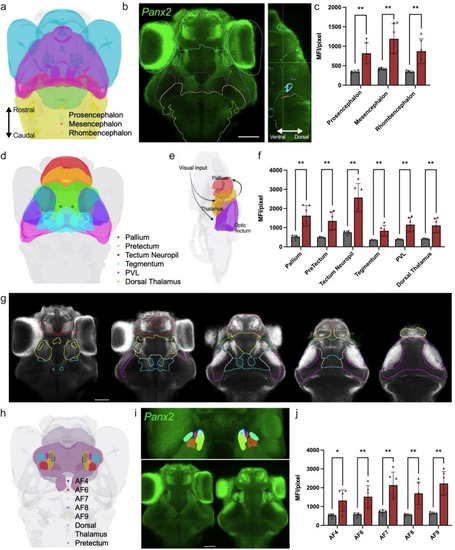
Panx2 mRNA is expressed broadly in the brain of zebrafish larvae. Spatial distribution of panx2 mRNA was determined by fluorescence in-situ hybridization. a) Three-brain region atlas derived from Kunst et al. [20] showing the major brain subdivisions: prosencephalon, mesencephalon, and rhombencephalon. b) Dorsal view of TL larvae expressing panx2 (green). Scale bar: 50 μm. c) Median fluorescence intensity (MFI) for regions described in (a), panx2 probe (red), control (same procedure without probe, grey). d) Three-dimensional view of larval zebrafish brain regions involved in the visual ascending pathway, acquired from mapZebrain. Regions outlined: pallium (red), pretectum (green), tectum neuropil (blue), tegmentum (cyan), periventricular layer (magenta) and dorsal thalamus (yellow). e) Simplified schematic of the visual processing pathway; visual input travels to the thalamus and optic tectum, subsequently projecting to the pallium. f) MFI for regions described in (d). g) Images from left to right represent sequential slices of panx2-labelled larval brain regions involved in the ascending visual pathway: axial views, ventral to dorsal. h) Three-dimensional view of larval zebrafish brain regions showing retinal arborization fields (AFs) 4, 6, 7, 8 and 9 that partially project within the dorsal thalamus and pretectum. Regions shown as: AF4 (blue), AF6 (red), AF7 (cyan), AF8 (magenta), AF9 (yellow), dorsal thalamus (purple) and pretectum (grey). i) Three-dimensional projection showing AFs mentioned in (h) (top panel). Images of panx2 expression within selected AF regions (bottom panel). j) MFI for regions described in (h). Scale bar: 50 μm. Statistical significance determined with a Welch's test. Significance: ****P-value<0.0001, ***P-value<0.001, P-value<0.01 and *P-value<0.05. Error bars = SD. Sample sizes for TL labelled with panx2 probe, n = 6; control probe, n = 5. See also Supplementary Figs. 1–3 and Supplementary Table 1. |

Generating a Panx2 global knockout zebrafish line. a) Exon-intron organization of the zebrafish Panx2 gene (ENSDARG00000063019, chromosome 18 (GRCz11:CM002902.2). The positions of the targeting Left and Right arms with a unique BamHI restriction endonuclease site in a spacer region between the TALEN pair are highlighted. b) Representation of the 11 bp deletion causing a premature stop codon. c) Graphical representation of the predicted Panx2 structure. The region in blue indicates the residual sequence of 27 amino acids followed by a new in-frame stop codon. Representative images (d) and comparison of body length between one-year-old zebrafish of different genotypes, both sexes. f) Real-time PCR quantification and presentation of the normalized expression of the three Panx2 isoforms, normalized to 18S rRNA. g) TL larvae showing that Panx2 proteins (green) are expressed throughout the retina. The expression was enriched in the outer retina, the inner plexiform layer, and the lens epithelium. DAPI is shown in magenta. h) After Panx2 ablation the expression was greatly reduced across the retina, with residual staining left in tissue known for high autofluorescence. i) Higher magnification of the outer retina showing the pronounced staining in sections of the inner photoreceptor segments, in TL larvae. j) Higher magnification of the lens epithelium of TL larvae. Abbreviations: SCL sclera, LE lens epithelium, GCL ganglion cell layer, IPL inner plexiform layer, INL inner nuclear layer, OPL outer plexiform layer, ONL outer nuclear layer, PRL photoreceptor layer. Scale bars: (g, h) 60 μm; (i, j) 10 μm. Statistics in e,f: Welch's test. Sample sizes were n = 26 for Panx2+/+ and n = 20 for Panx2Δ11. Significance: ***P-value<0.001 and *P-value<0.05. Error bars = SD. (For interpretation of the references to colour in this figure legend, the reader is referred to the web version of this article.) |
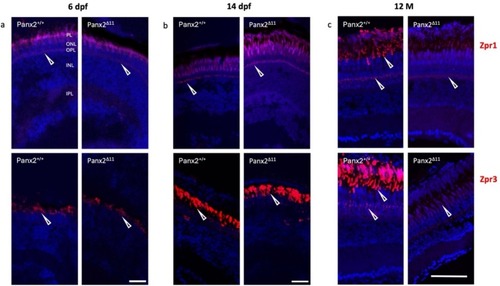
Cone and rod biomarker expression is reduced in adult Panx2 Δ11 retina. Antibody staining with Zpr1 and Zpr3 antibodies, shown in red, exhibited double cone photoreceptors, and outer segments of rods and green cones, respectively. No difference between genotypes was observed at the early stages, 6 dpf (a) and 14 dpf (b). The adult stage showed decreased Zpr1 and Zpr3 immunofluorescence in 12-month-old Panx2 Δ11 retina. Nuclei were shown in blue using DAPI. Abbreviations: photoreceptor layer (PL), outer nuclear layer (ONL), outer plexiform layer (OPL), inner nuclear layer (INL), inner plexiform layer (IPL), and 12-month-old (12 M). Scale bars: (a, b) 20 μm; (c) 50 μm. (For interpretation of the references to colour in this figure legend, the reader is referred to the web version of this article.) |
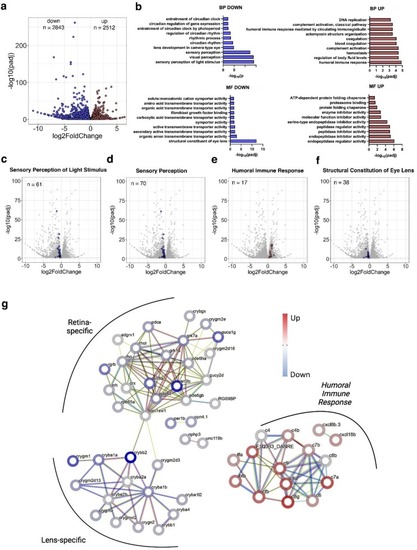
Panx2 ablation regulates vision processes and structural components of the lens in larvae. a) A DESeq2 analysis of RNA-seq data from Panx2+/+ and Panx2Δ11 6 dpf zebrafish larvae identified 5355 differentially expressed genes with an adjusted P-value <0.05 b) Analysis of differentially expressed genes using GOSeq (v1.56.0). The Gene Ontology Classifier Biological Process (BP) showed significant downregulation of several vision-related categories. c,d) The most significantly down-regulated biological processes included Sensory Perception of Light Stimulus (GO:0050953) and Sensory Perception (GO:0007600). e) The top up-regulated BP was Humoral Immune Response (GO:0006959). f) The most significantly down-regulated Molecular Function (MF) was the Structural Component of the Lens (GO:0005212). g) STRING analysis of 61 regulated genes annotated as Sensory Perception of Light Stimulus (GO:0050953) and 17 regulated genes annotated as Humoral Immune Response (GO:0006959). K-means clustering identified two clusters which were either retina- or lens-specific. Cluster I genes are implicated in the phototransduction processes of the retina. Cluster II represents lens-specific proteins belonging to the alpha- or beta/gamma supergene families. A third group represents the humoral immune response. See also Supplementary Tables 2–5. |

Light-ON and light-OFF conditions affect free swimming of Panx2Δ11 larvae. Representative images of a single-well showing examples of Panx2+/+ and Panx2Δ11 larvae locomotion patterns in the light (a). Medium (<20 mm/s) or high-speed movements (>20 mm/s) are visualized with green and red colors, respectively. Graphs demonstrate mean experimental traces ±95 % CI of distance traveled (mm) and speed (mm/s) of 6 dpf larvae for 30 min (b,c) and their corresponding mean values, in the light. d) Representative images for each genotype, in the dark. Tracked experimental traces of distance and speed under dark conditions (e,f) and their corresponding mean ± SD. Sample sizes were n = 24 larvae for each genotype. A Welch's t-test was used for statistical comparison between groups. Significance: ****P-value<0.0001 and *P-value<0.05. Error bars = SD. (For interpretation of the references to colour in this figure legend, the reader is referred to the web version of this article.) |
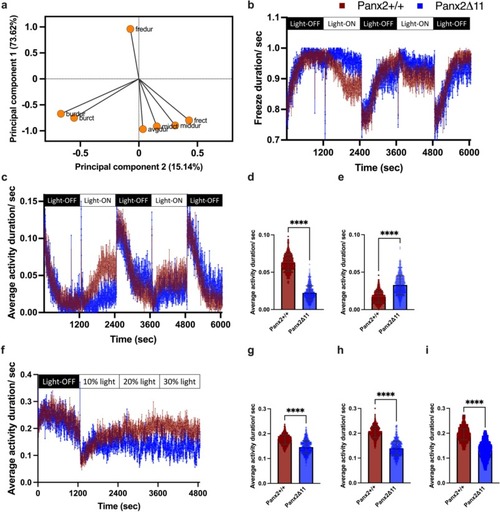
Panx2 ablation affects visual-motor response to light-ON and light-OFF stimuli in larvae. Principal component analysis was performed using multivariable activity data. a) The variable correlation plot indicates the coordinates of seven variables within the first two dimensions, where PC1 and PC2 capture 73.62 % and 15.14 % of the data variance, respectively. b) Line graph showing patterns of immobility with mean freeze duration activity for Panx2+/+ (red) and Panx2Δ11 (blue) over alternating 20-min periods of light-ON and light-OFF conditions. c) Line graph showing the mean average activity. Mean activity, with error bars showing SD for d) light-ON and e) light-OFF conditions, ****P-value<0.0001. f) Line graph showing the mean average activity for Panx2+/+ (red) and Panx2Δ11 (blue) during an initial light-OFF period, followed by 20-min increments of increasing light intensities. Mean activity, with error bars showing SD during g) 10 % light intensity, h) 20 % light intensity and i) 30 % light intensity. ****P-value<0.0001. Data shown for n = 24 larvae for each genotype. (For interpretation of the references to colour in this figure legend, the reader is referred to the web version of this article.) |

Panx2 ablation impairs the optomotor response of larvae. OMR was used to assess optic flow processing in 6 dpf Panx2+/+ and Panx2Δ11 larvae, at two light intensities (10 % and 100 %). Both groups were shown visual stimulus of moving stripes at three spatial frequencies (64, 128, and 256), which were presented at 72 pixels/s and 144 pixels/s. The line graphs show the percentage of larvae that indicated the expected positive response, from n = 16 for each genotype. Panx2Δ11 larvae had significantly lower visual acuity when compared to Panx2+/+. ***P-value<0.001, **P-value<0.01, *P-value<0.05, ns = not a significant difference. See also Supplementary Table 6. |

Panx2 loss leads to lens malformation and decreased retinal thickness in adult zebrafish. Eyes of adult fish were imaged using a SD-OCT system. a) Schematic definition of four geometric parameters used for quantification of high-resolution OCT Whole-eye images. Representative images of Panx2+/+ (b) and Panx2Δ11 (c,d), showing disruptions in lens epithelium. Scale bars = 500 μm. Bar plots showing spread of quantified geometric parameters for the axial length normalized to body length (e), relative refractive error (f), corneal thickness normalized to lens diameter (h), and retinal thickness normalized to lens diameter (h) collectively showing significant differences between the genotypes. Sample sizes for Panx2+/+ and Panx2Δ11 were 38 and 40 eyes from 19 and 20 fish, respectively. Significance: ***P-value <0.001 and ****P-value <0.0001. See also Supplementary Table 7. |
Reprinted from Biochimica et biophysica acta. Molecular basis of disease, , Shanbhag, R., Zoidl, G.S.O., Nakhuda, F., Sabour, S., Nauman, H., Zoidl, C., Bahl, A., Tabatabaei, N., Zoidl, G.R., Pannexin-2 deficiency disrupts visual pathways and leads to ocular defects in zebrafish, 167807167807, Copyright (2025) with permission from Elsevier. Full text @ BBA Molecular Basis of Disease