
Fig. 1
- ID
- ZDB-FIG-250507-36
- Publication
- Shanbhag et al., 2025 - Pannexin-2 deficiency disrupts visual pathways and leads to ocular defects in zebrafish
- Other Figures
- All Figure Page
- Back to All Figure Page
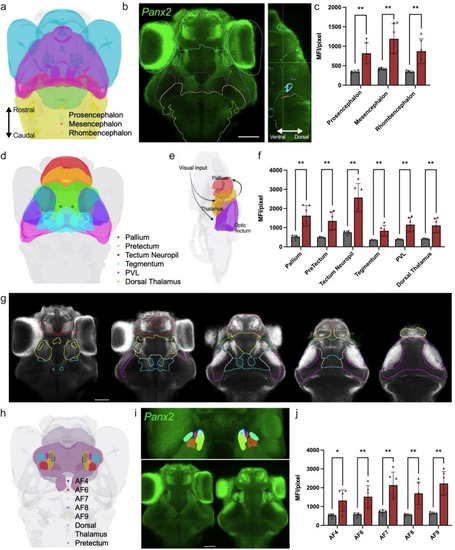
Panx2 mRNA is expressed broadly in the brain of zebrafish larvae. Spatial distribution of panx2 mRNA was determined by fluorescence in-situ hybridization. a) Three-brain region atlas derived from Kunst et al. [20] showing the major brain subdivisions: prosencephalon, mesencephalon, and rhombencephalon. b) Dorsal view of TL larvae expressing panx2 (green). Scale bar: 50 μm. c) Median fluorescence intensity (MFI) for regions described in (a), panx2 probe (red), control (same procedure without probe, grey). d) Three-dimensional view of larval zebrafish brain regions involved in the visual ascending pathway, acquired from mapZebrain. Regions outlined: pallium (red), pretectum (green), tectum neuropil (blue), tegmentum (cyan), periventricular layer (magenta) and dorsal thalamus (yellow). e) Simplified schematic of the visual processing pathway; visual input travels to the thalamus and optic tectum, subsequently projecting to the pallium. f) MFI for regions described in (d). g) Images from left to right represent sequential slices of panx2-labelled larval brain regions involved in the ascending visual pathway: axial views, ventral to dorsal. h) Three-dimensional view of larval zebrafish brain regions showing retinal arborization fields (AFs) 4, 6, 7, 8 and 9 that partially project within the dorsal thalamus and pretectum. Regions shown as: AF4 (blue), AF6 (red), AF7 (cyan), AF8 (magenta), AF9 (yellow), dorsal thalamus (purple) and pretectum (grey). i) Three-dimensional projection showing AFs mentioned in (h) (top panel). Images of panx2 expression within selected AF regions (bottom panel). j) MFI for regions described in (h). Scale bar: 50 μm. Statistical significance determined with a Welch's test. Significance: ****P-value<0.0001, ***P-value<0.001, P-value<0.01 and *P-value<0.05. Error bars = SD. Sample sizes for TL labelled with panx2 probe, n = 6; control probe, n = 5. See also Supplementary Figs. 1–3 and Supplementary Table 1. |
Reprinted from Biochimica et biophysica acta. Molecular basis of disease, , Shanbhag, R., Zoidl, G.S.O., Nakhuda, F., Sabour, S., Nauman, H., Zoidl, C., Bahl, A., Tabatabaei, N., Zoidl, G.R., Pannexin-2 deficiency disrupts visual pathways and leads to ocular defects in zebrafish, 167807167807, Copyright (2025) with permission from Elsevier. Full text @ BBA Molecular Basis of Disease