FIGURE SUMMARY
Title

Analysis of tumor-infiltrating exhausted T cells highlights IL-6 and PD1 blockade as a combined immunotherapy strategy for non-small cell lung cancer

Authors
Zhang, L., Guo, X., Sun, X., Liao, J., Liu, Q., Ye, Y., Yang, Z., Cressey, R., He, Q., Yuan, Q.
Source
Full text @ Front Immunol

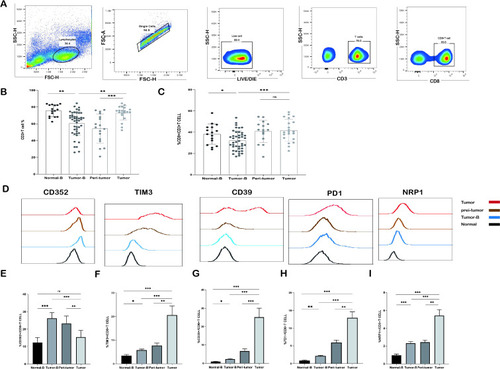
Frequency of CD3+ T cells and CD8+ T cells detected by flow cytometry. (A) Gating strategy for identifying CD3+ T cells and their subpopulations by flow cytometry. (B) Comparison of the frequency distribution and pairwise distribution of CD3+ T cells and CD8+ T cells in the peripheral blood of the Normal-B group (n = 16), Tumor-B group (n = 46), peri-tumor group (n = 17), and Tumor group (n = 20). (C) Frequency distribution and pairwise comparison of CD8+ T cells in peripheral blood in the Normal-B group (n = 16), Tumor-B group (n = 46), peri-tumor group (n = 17), and Tumor group (n = 20). (D) Typical staining of CD352, TIM3, CD39, PD1, and NRP1 expression in CD8+ T cells in the Normal-B, Tumor-B, and Tumor groups. (E-I) Frequency plots of CD352, TIM3, CD39, PD1, and NRP1 expression in CD8+ T cells in the Normal-B, Tumor-B, peri-tumor, and Tumor groups. Normal-B, Tumor-B, peri-tumor, and Tumor groups are peripheral blood PBMC group of healthy volunteers, peripheral blood PBMC group of patients with non-small cell lung cancer (NSCLC), paracancerous tissue group of patients with NSCLC, and cancerous tissue group of patients with NSCLC, respectively. ns, not statistically significant. *P < 0.05, **P < 0.01, ***P < 0.001.

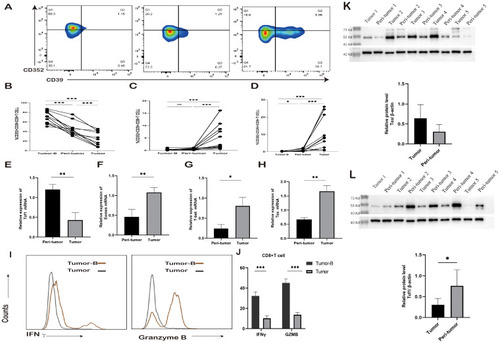
Changes in exhausted CD8+ T cell subsets. (A) Typical staining and expression frequency of CD352 and CD39 on CD8+ T cells in the Tumor-B, peri-tumor, and Tumor groups of the same lung cancer patients. Horizontal lines represent mean values. (B-D) Comparison of the expression frequency of CD352 and CD39 in CD8+ T cells in the Tumor-B, peri-tumor, and Tumor groups of the same lung cancer patients. (E) The mRNA expression level of Tcf1 in the peri-tumor and Tumor groups. (F) The mRNA expression level of Emoes in the peri-tumor and Tumor groups. (G) The mRNA expression level of T-bet in the peri-tumor and Tumor groups. (H) The mRNA expression level of Tox in the peri-tumor and Tumor groups. (I) Typical staining of CD8+ T cells producing IFN-γ and GZMB in the Tumor-B and Tumor groups. (J) Comparison of the frequency of IFN-γ and GZMB production by CD8+ T cells in the Tumor-B and Tumor groups. (K)The protein expression level of Tcf1 in the peri-tumor and Tumor groups. (L) The protein expression level of Tox in the peri-tumor and Tumor groups. The Tumor-B group was the peripheral blood PBMC group of patients with non-small cell lung cancer. The peri-tumor and Tumor groups were the paracancerous tissue group and cancer tissue group of patients with non-small cell lung cancer, respectively. ns, not statistically significant. *P < 0.05, **P < 0.01, ***P < 0.001.

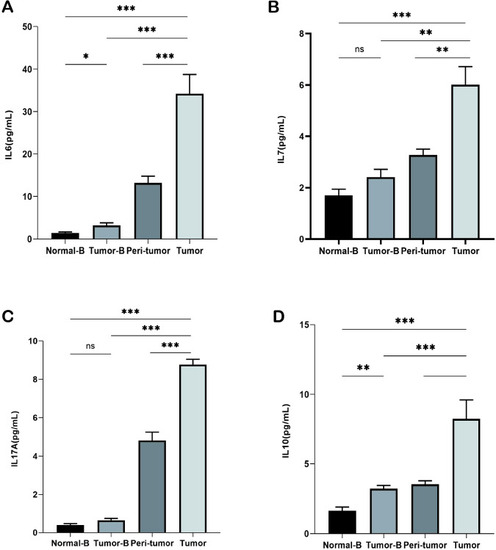
Detection of cytokines in plasma and tissue homogenization supernatants. (A) Detection of IL-6 levels in the Normal-B, Tumor-B, peri-tumor, and Tumor groups. (B) Detection of IL-7 levels in the Normal-B, Tumor-B, peri-tumor, and Tumor groups. (C) Detection of IL-17A levels in the Normal-B, Tumor-B, peri-tumor, and Tumor groups. (D) Detection of IL-10 levels in the Normal-B, Tumor-B, peri-tumor, and Tumor groups. Note: The Normal-B, Tumor-B, peri-tumor, and Tumor groups were the peripheral blood PBMC group of healthy volunteers, the peripheral blood PBMC group of non-small cell lung cancer, and the peritumor tissue and the cancerous tissue groups of patients with non-small cell lung cancer, respectively. ns, not statistically significant. *P < 0.05, **P < 0.01, ***P < 0.001.

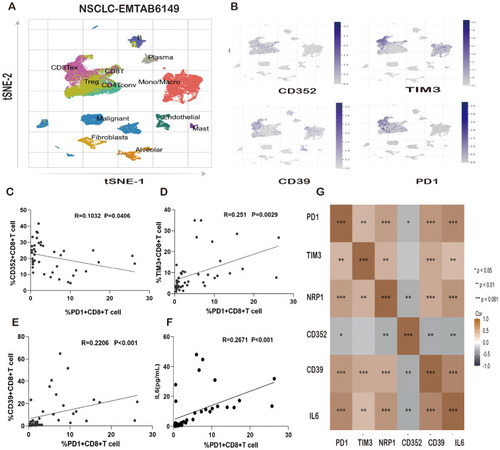
Correlation of IL-6 and PD-1 expression levels with T-cell exhaustion markers in lung cancer patients. (A) Distribution of immune cells in the NSCLC single-cell sequencing data (EMTAB6149). (B) Distribution of CD352, TIM3, CD39, and PD1 expression in the NSCLC single-cell sequencing data (EMTAB6149). (C) Correlation of the PD1+CD8+T-cell ratio with the CD352+CD8+ T-cell ratio in lung cancer patients. (D) Correlation between the PD1+ CD8+ T-cell ratio and the TIM3+CD8+ T-cell ratio in lung cancer patients. (E) Correlation between the PD1+CD8+T-cell ratio and CD39+CD8+ T-cell ratio in lung cancer patients. (F) Correlation between the PD1+CD8+ T-cell ratio and IL-6 expression in lung cancer patients. (G) Heatmap analysis of the correlation between IL-6 and PD1, TIM3, NRP1, CD352, and CD39 in patients with lung cancer. ns, not statistically significant. *P < 0.05, **P < 0.01, ***P < 0.001.

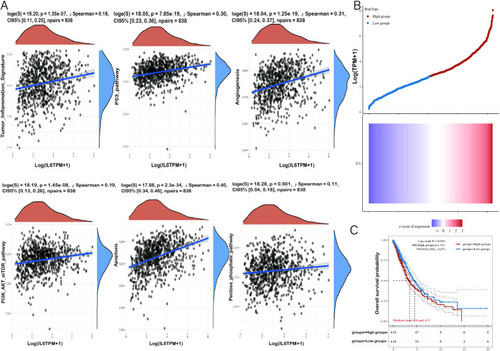
Correlation analysis of IL-6 gene with tumor-related pathways and prognosis.
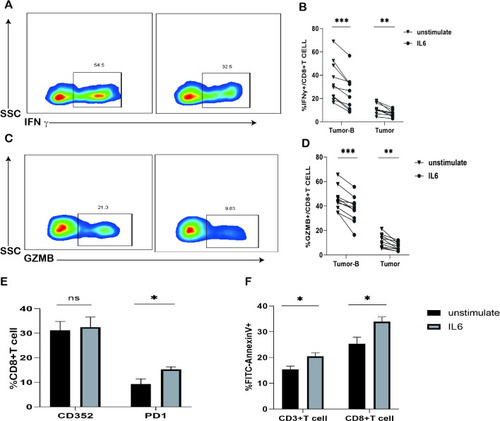
 (A) The X-axis represents the distribution of IL-6 gene expression and the Y-axis represents the distribution of tumor signaling pathway scores. The density curves on the right side represent the distribution trend of pathway scores, and the density curves on the top side represent the distribution trend of IL-6 expression. The top values represent the results of Spearman’s correlation analysis, including p-value, correlation coefficient, and correlation calculation method. (B) The Relationship between gene expression and survival time and survival status of tumor patients in TCGA data. the upper graph represents the scatter plot of IL-6 expression from low to high, with different colors representing different expression groups; the lower graph represents the heat map of gene expression. (C) KM survival curves of the gene in TCGA data, where different groups were examined using log-rank. HR (High exp) refers to the risk coefficient of the samples in the high-expression group relative to the samples in the low-expression group. If HR > 1, the gene is a risk factor (the higher the expression, the worse the prognosis). If HR < 1, the gene is a protective factor (higher expression, better prognosis). 95% CI indicates the confidence interval of HR; median time indicates the time corresponding to the survival rate of the high expression group and the low expression group at 50% of the time. e., Median survival time in years.

Effects of IL-6 in vitro stimulation on T cells. (A) Typical graph of reduced GZMB expression in CD8+ T cells in the Tumor-B and Tumor groups after 24 h of IL-6 treatment. (B) Frequency graph of reduced IFN-γ expression in CD8+ T cells of the Tumor-B and Tumor groups after 24 h of IL-6 treatment. (C) Typical graph of reduced GZMB expression in CD8+ T cells of the Tumor-B and Tumor groups after 24 h of IL-6 treatment. (D) Frequency graph of reduced GZMB expression in CD8+ T cells of the Tumor-B and Tumor groups after 24 h of IL-6 treatment. (E) Frequency graph of CD8+ T cells in the peripheral blood after stimulation with the IL-6 recombinant protein (F) Increased apoptosis of CD3+ T cells and CD8+ T cells in the peripheral blood after IL-6 treatment for 24 h. Note: Tumor-B and Tumor groups were the peripheral blood PBMC group and the cancer tissue group of patients with non-small cell lung cancer, respectively. ns, not statistically significant. *P < 0.05, **P < 0.01, ***P < 0.001.

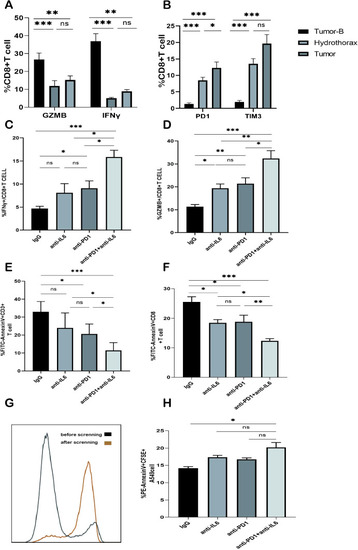
Effect of the combined blockade of PD1 and IL-6 on CD8+ T cells in vitro. (A) Frequency plot of IFN-γ and GZMB expression in CD8+ T cells of the Tumor-B, Hydrothorax, and Tumor groups. (B) Frequency plot of CD8+ T cells expressing PD1 and TIM3 in the pleural effusion of the Tumor-B group. (C) Frequency of IFN-γ expression in the pleural effusion of lung cancer patients after anti-PD1 and/or anti-IL-6 blockade. (D) Frequency of GZMB expression in the pleural effusion of lung cancer patients after anti-PD1 and/or anti-IL6 blockade. (E) Frequency of CD3+ T cell apoptosis in the pleural effusion of lung cancer patients after PD1 and/or IL-6 blockade. (F) Frequency of CD8+ T cell apoptosis in the pleural effusion of lung cancer patients after PD1 and/or IL-6 blockade. (G) CD8+ T cells before and after magnetic bead sorting. (H) Typical map and expression frequency map of A549 cell apoptosis in the pleural effusion of lung cancer patients after the blockade with PD1 and/or IL-6; ns, not statistically significant. *P < 0.05, **P < 0.01, ***P < 0.001.

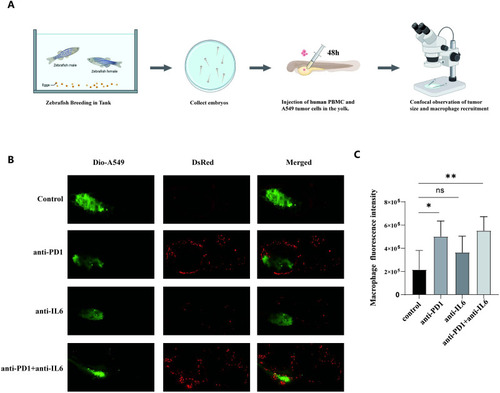
Macrophage recruitment by combination treatment with nivolumab and anti-IL-6 antibody. (A) The process of zebrafish model construction. (B) Comparison of zebrafish macrophage fluorescence between control and experimental groups. (C) Statistical analysis of zebrafish macrophage fluorescence intensity between control and experimental groups (mean ± SD, n = 5). ns, not statistically significant. *P < 0.05, **P < 0.01.

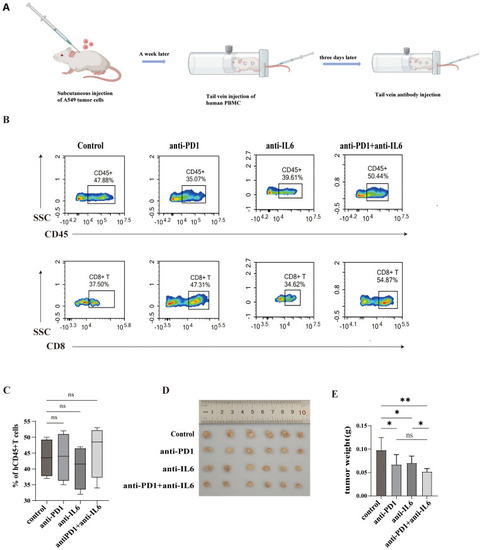
Combined blockade of PD1 and IL-6 on humanized mouse tumors. (A)Construction of a humanized hormonal mouse model and process of antibody administration. (B, C) Flow cytometry assays were performed to assess mouse peripheral blood HuCD45+T cells and HuCD8+T cells and their proportions. (D) Comparison of tumors in control and experimental mice. (E) Tumor weights of control and experimental mice. ns, not statistically significant. *P < 0.05, **P < 0.01.

Acknowledgments
This image is the copyrighted work of the attributed author or publisher, and ZFIN has permission only to display this image to its users. Additional permissions should be obtained from the applicable author or publisher of the image. Full text @ Front Immunol