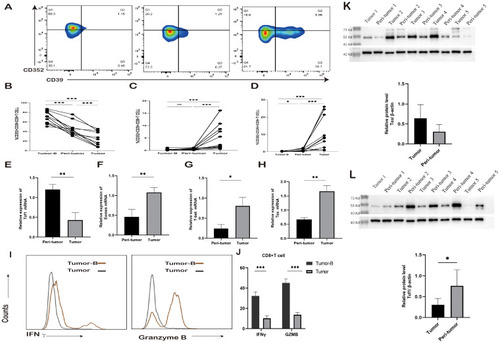
Changes in exhausted CD8+ T cell subsets. (A) Typical staining and expression frequency of CD352 and CD39 on CD8+ T cells in the Tumor-B, peri-tumor, and Tumor groups of the same lung cancer patients. Horizontal lines represent mean values. (B-D) Comparison of the expression frequency of CD352 and CD39 in CD8+ T cells in the Tumor-B, peri-tumor, and Tumor groups of the same lung cancer patients. (E) The mRNA expression level of Tcf1 in the peri-tumor and Tumor groups. (F) The mRNA expression level of Emoes in the peri-tumor and Tumor groups. (G) The mRNA expression level of T-bet in the peri-tumor and Tumor groups. (H) The mRNA expression level of Tox in the peri-tumor and Tumor groups. (I) Typical staining of CD8+ T cells producing IFN-γ and GZMB in the Tumor-B and Tumor groups. (J) Comparison of the frequency of IFN-γ and GZMB production by CD8+ T cells in the Tumor-B and Tumor groups. (K)The protein expression level of Tcf1 in the peri-tumor and Tumor groups. (L) The protein expression level of Tox in the peri-tumor and Tumor groups. The Tumor-B group was the peripheral blood PBMC group of patients with non-small cell lung cancer. The peri-tumor and Tumor groups were the paracancerous tissue group and cancer tissue group of patients with non-small cell lung cancer, respectively. ns, not statistically significant. *P < 0.05, **P < 0.01, ***P < 0.001.
|
